- Events
-
Partners
- Government
- Customer Portal
- Contact Us
- Contact Sales
-
English
SolarWinds® Server & Application Monitor (SAM) offers out-of-the-box templates to monitor the performance of 200+ enterprise applications. Automatically discover Linux servers and applications, apply built-in templates, and typically start monitoring in about an hour.
Server & Application Monitor lets you monitor databases and web servers, email servers, application servers, messaging servers, and more via a host of protocols, including SNMP, JMX, WMI, and CIM. You can extend monitoring to any custom or homegrown application by customizing existing out-of-the-box templates or building new ones.
The Linux server monitoring tools in SolarWinds Server & Application Monitor allow you to monitor, alert, and report on performance issues in your Linux servers.
Server & Application Monitor supports many Linux distributions, including Red Hat Enterprise Linux monitoring, CentOS, SUSE Linux Enterprise Server, Ubuntu Server, Debian, Fedora, and more.
Linux monitoring tools in SAM allow you to monitor resource utilization on your Linux servers. Receive alerts about CPU overloads, insufficient RAM, and storage issues, such as disks running out of capacity. SAM helps keep you prepared with capacity forecasts and more.
Monitor the health of hardware components in your Linux server, including temperature, CMC, fan speed, power supply, blade chassis, and more. Receive alerts when server hardware components are in warning or critical states and reduce server downtime due to hardware failure.
No matter where your Linux applications are running, on a physical or virtual server, on-premises, in the cloud, or hybrid environment, Server & Application Monitor’s Linux server monitoring tool helps you isolate the root cause in minutes. Built-in virtualization monitoring helps you identify whether there are resource contention issues at the host or virtual machine. Choose between agent-based and agentless monitoring.
Use the built-in AppStack™ dashboard to visualize contextual relationship mapping between applications and the underlying physical and virtual infrastructure. This accelerates issue diagnosis and troubleshooting.
Note: Server & Application Monitor installs on a Windows server, but it can monitor heterogeneous environments running on Linux and Windows.
Linux performance monitoring is the process of keeping track of key metrics to help you understand and stay on top of your Linux system. It helps you both ensure and further optimize the availability and performance of your OS environment—two critical factors for maintaining the systems that keep your organization running. By keeping an eye on those essential metrics as you monitor Linux performance, you are better equipped to proactively prevent problems from occurring. When problems occur, Linux performance monitoring makes it easier to locate what’s causing the problem thanks to your collected performance data, which makes it easier to pinpoint and troubleshoot the root cause of the problem.
Whether you’re looking to monitor remote Linux or on-premises Linux, the metrics central to the performance monitoring process are:
When it comes to Linux performance monitoring, the best way to stay on top of these metrics and make the most of the Linux process is to use a performance monitoring tool, like SolarWinds Server & Application Monitor (SAM).
Linux servers play a huge role in the organizations that use them, as they can be used to run applications from databases and web servers to infrastructure services and critical apps like CRM and SAP systems. Monitoring those servers consistently is the best way to ensure they can perform without major issues.
If a server slows down, there can be major implications for everything from productivity to performance. Identifying the cause of a slowdown quickly is essential for reducing its impact. When you consistently monitor system processes, you can easily check in on the essential metrics that alert you to what’s causing the slowdown. If you use a tool for your Linux performance monitoring, you don’t have to search through the data yourself. Instead, the system will alert you as soon as it detects something out of the ordinary with any of your monitored metrics. This leads to faster troubleshooting and, in turn, faster problem resolution.
Complete visibility is essential for the success of any Linux system. Monitoring the performance of on-premises or remote Linux systems is the best way to gain visibility. And, when done well, monitoring the Linux process can help you proactively optimize your servers further to boost performance above your normal levels.
SolarWinds Server & Application Monitor (SAM) is an agentless solution designed to make monitoring Linux performance simple thanks to an easy-to-use interface, round-the-clock monitoring of essential metrics, advanced alerting, and more.
No matter what desktop environment you’re working with, it’s easy to monitor Linux performance with SAM. The tool comes with expert templates help you determine what you should monitor in your environment and why. Pick the one that’s right for you and then, if you need, you can add component monitors to any of the templates you choose, so SAM is always monitoring the metrics that matter most to you. Once the template is ready, click the button to apply it, and SAM will start monitoring your Linux system performance.
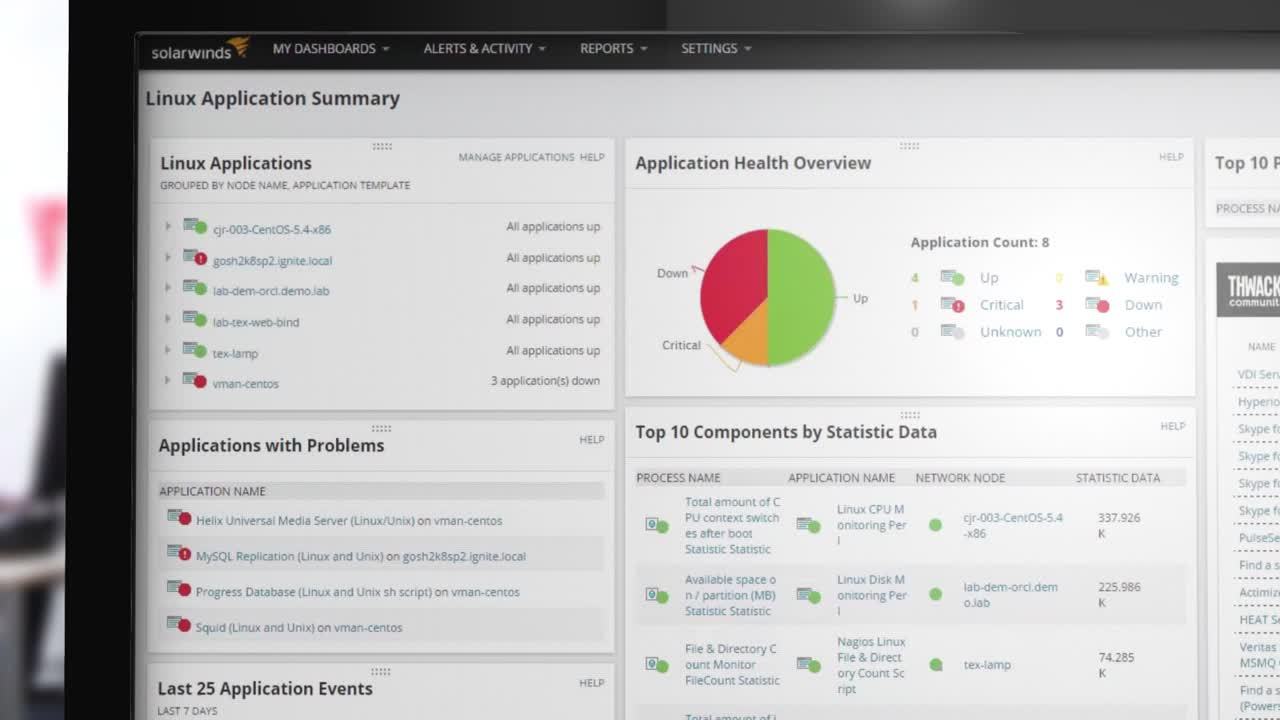
Once monitoring starts, you can use SAM’s intuitive dashboard to view information about your Linux environment at a glance. If there are any details you want to drill into, you can click on the relevant data to get more information. If you want a visual representation of the data, SAM lets you view your Linux component statuses in the form of pie charts, graphs, gauges, and more—and you can use the same drill-down capability from those charts as from the general dashboard.
Once you’ve set up your monitoring in SAM, you can rest easy knowing you’ll be alerted as soon as your attention is needed. With SAM, you can quickly configure alert engines so you can respond to hundreds of different scenarios. SAM can suggest thresholds for you, or you can set your own alert thresholds for each component, so you’re never out of the loop. As soon as an alert is triggered, you can follow the alert and take necessary corrective measures before more users are affected.
Other SolarWinds tools to help monitor Linux environments:
Related features:
Linux performance monitoring is the process of keeping track of key metrics to help you understand and stay on top of your Linux system. It helps you both ensure and further optimize the availability and performance of your OS environment—two critical factors for maintaining the systems that keep your organization running. By keeping an eye on those essential metrics as you monitor Linux performance, you are better equipped to proactively prevent problems from occurring. When problems occur, Linux performance monitoring makes it easier to locate what’s causing the problem thanks to your collected performance data, which makes it easier to pinpoint and troubleshoot the root cause of the problem.
Whether you’re looking to monitor remote Linux or on-premises Linux, the metrics central to the performance monitoring process are:
When it comes to Linux performance monitoring, the best way to stay on top of these metrics and make the most of the Linux process is to use a performance monitoring tool, like SolarWinds Server & Application Monitor (SAM).
Linux servers play a huge role in the organizations that use them, as they can be used to run applications from databases and web servers to infrastructure services and critical apps like CRM and SAP systems. Monitoring those servers consistently is the best way to ensure they can perform without major issues.
If a server slows down, there can be major implications for everything from productivity to performance. Identifying the cause of a slowdown quickly is essential for reducing its impact. When you consistently monitor system processes, you can easily check in on the essential metrics that alert you to what’s causing the slowdown. If you use a tool for your Linux performance monitoring, you don’t have to search through the data yourself. Instead, the system will alert you as soon as it detects something out of the ordinary with any of your monitored metrics. This leads to faster troubleshooting and, in turn, faster problem resolution.
Complete visibility is essential for the success of any Linux system. Monitoring the performance of on-premises or remote Linux systems is the best way to gain visibility. And, when done well, monitoring the Linux process can help you proactively optimize your servers further to boost performance above your normal levels.
SolarWinds Server & Application Monitor (SAM) is an agentless solution designed to make monitoring Linux performance simple thanks to an easy-to-use interface, round-the-clock monitoring of essential metrics, advanced alerting, and more.
No matter what desktop environment you’re working with, it’s easy to monitor Linux performance with SAM. The tool comes with expert templates help you determine what you should monitor in your environment and why. Pick the one that’s right for you and then, if you need, you can add component monitors to any of the templates you choose, so SAM is always monitoring the metrics that matter most to you. Once the template is ready, click the button to apply it, and SAM will start monitoring your Linux system performance.
Once monitoring starts, you can use SAM’s intuitive dashboard to view information about your Linux environment at a glance. If there are any details you want to drill into, you can click on the relevant data to get more information. If you want a visual representation of the data, SAM lets you view your Linux component statuses in the form of pie charts, graphs, gauges, and more—and you can use the same drill-down capability from those charts as from the general dashboard.
Once you’ve set up your monitoring in SAM, you can rest easy knowing you’ll be alerted as soon as your attention is needed. With SAM, you can quickly configure alert engines so you can respond to hundreds of different scenarios. SAM can suggest thresholds for you, or you can set your own alert thresholds for each component, so you’re never out of the loop. As soon as an alert is triggered, you can follow the alert and take necessary corrective measures before more users are affected.
Server & Application Monitor
Automatic application discovery and server monitoring.
Quickly monitor the performance and availability of Microsoft Azure and Amazon AWS services.
Built-in templates provide best practices.