- Events
-
Partners
- Government
- Customer Portal
- Contact Us
- Contact Sales
-
English
SolarWinds® Server & Application Monitor (SAM) offers comprehensive application monitoring for Apache Geronimo or Tomcat servers, memory, usages, and apps, along with virtual machines and programs like SQL Server, Exchange, and Active Directory.
Get monitoring, reporting, alerting, and asset inventory in one product. Easily customize alerts, reports, and dashboards for your enterprise-wide needs, and use baselines to compare Geronimo or Tomcat application performance and alert when issues occur.
Geronimo and Tomcat performance monitoring refers to the process of gathering and analyzing several different metrics related to Apache Tomcat and Geronimo servers, which are for Java-based web applications. This can be more easily achieved using Geronimo and Tomcat monitoring tools, which collect and synthesize performance information into an easy to comprehend-user interface.
Geronimo is an application server and compatible with Java Enterprise Edition, or Java EE. Apache Tomcat runs is a lightweight, popular web application server option server for smaller Java web applications. However, Tomcat is a servlet container and not compatible with Java EE.
Both Geronimo and Tomcat are open-source projects, allowing IT administrators to configure their server settings to meet their preferences and criteria. The active community of users also provides an online base of support and information should the need for troubleshooting arise.
Apache Geronimo and Tomcat monitoring software tracks metrics through access logs and Java Management Extensions (or JMX), a technology providing tools for application and device monitoring. JMX offers a high-level, big-picture view of metrics, while access logs provide more granular detail about individual requests and request types. By monitoring both types of metrics, Geronimo and Tomcat server performance monitoring tools can provide a comprehensive view on the server’s health and efficiency.
There are several key metrics Geronimo and Tomcat performance monitors may track to provide actionable data IT administrators can use to make informed decisions about server performance. These include but are not limited to:
Using Geronimo and Tomcat performance monitoring tools is vital for many interrelated reasons, but the ultimate reason is end users need to be able to use business resources, including Geronimo and Tomcat servers, without interruption. With an application monitor, it’s easier to keep up business productivity.
Monitoring Apache server performance is an essential part of ensuring Java applications in production run successfully. Geronimo and Tomcat server monitoring involves confirming applications respond to requests without lagging and ensuring the code functions without memory leaks—but also simply provides information to be used in general troubleshooting.
End users have grown accustomed to speedy response times—and speed is essential for any organization—which is why it’s essential to monitor Geronimo and Tomcat server performance metrics to proactively catch issues negatively affecting performance.
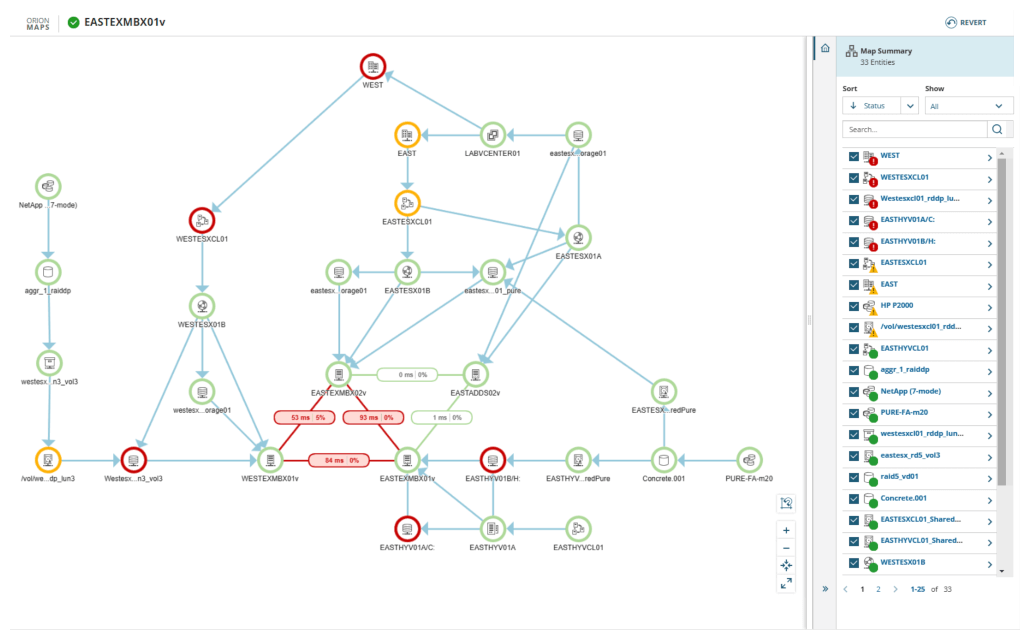
Third-party Geronimo and Tomcat monitoring tools are designed to provide high-level visibility to server performance by providing visualized metrics allowing for quick parsing of data trends and potential pain points.
By giving IT admins access to comprehensive information about the performance of Java application servers (and potentially non-Tomcat servers as well), Geronimo and Tomcat monitoring tools can help ensure better end-user experience while freeing up your time to devote to more mission-critical tasks.
Apache monitoring tools can make it easier to keep track of Java applications in production, which has the added benefit of giving administrators insights into potential issues before they occur. Without the insights into pattern detection Geronimo and Tomcat monitoring provides, it becomes much more difficult to identify the cause of issues. For instance, low memory can cause a JVM to slow down considerably. This in turn causes the performance of whatever applications the JVM is running to also slow down.
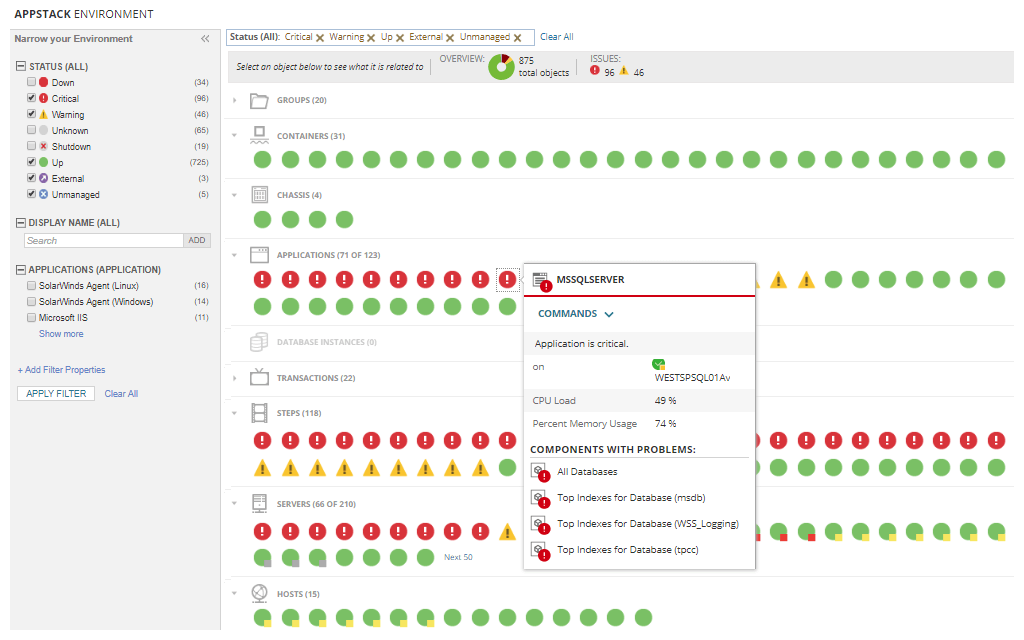
SolarWinds SAM is built to provide Geronimo and Tomcat server monitoring software built to work right out of the box, including application monitoring for components from Tomcat servers and applications to virtual layers and other business-critical applications like SQL Server, Exchange, and Active Directory.
SAM gives you the ability to customize alerts, reports, and dashboards to fit the needs and preferences of your organization, whether you’re supporting a small business or an enterprise. SAM server monitoring software can be used to collaborate across server, web, database, and application teams, allowing you to use baselines to compare application performance and create more accurate and useful alerts for when apps start having issues. Plus, you can establish custom thresholds for the various counters used to track performance metrics.
SAM monitors several server components, including Geronimo application server and Tomcat memory usage monitoring metrics like:
In addition to the other server monitoring capabilities it provides, SAM is designed to be a robust and comprehensive Geronimo and Tomcat monitoring tool built to combine monitoring, reporting, alerting, and asset inventory in one solution.
Geronimo and Tomcat performance monitoring refers to the process of gathering and analyzing several different metrics related to Apache Tomcat and Geronimo servers, which are for Java-based web applications. This can be more easily achieved using Geronimo and Tomcat monitoring tools, which collect and synthesize performance information into an easy to comprehend-user interface.
Geronimo is an application server and compatible with Java Enterprise Edition, or Java EE. Apache Tomcat runs is a lightweight, popular web application server option server for smaller Java web applications. However, Tomcat is a servlet container and not compatible with Java EE.
Both Geronimo and Tomcat are open-source projects, allowing IT administrators to configure their server settings to meet their preferences and criteria. The active community of users also provides an online base of support and information should the need for troubleshooting arise.
Apache Geronimo and Tomcat monitoring software tracks metrics through access logs and Java Management Extensions (or JMX), a technology providing tools for application and device monitoring. JMX offers a high-level, big-picture view of metrics, while access logs provide more granular detail about individual requests and request types. By monitoring both types of metrics, Geronimo and Tomcat server performance monitoring tools can provide a comprehensive view on the server’s health and efficiency.
There are several key metrics Geronimo and Tomcat performance monitors may track to provide actionable data IT administrators can use to make informed decisions about server performance. These include but are not limited to:
Using Geronimo and Tomcat performance monitoring tools is vital for many interrelated reasons, but the ultimate reason is end users need to be able to use business resources, including Geronimo and Tomcat servers, without interruption. With an application monitor, it’s easier to keep up business productivity.
Monitoring Apache server performance is an essential part of ensuring Java applications in production run successfully. Geronimo and Tomcat server monitoring involves confirming applications respond to requests without lagging and ensuring the code functions without memory leaks—but also simply provides information to be used in general troubleshooting.
End users have grown accustomed to speedy response times—and speed is essential for any organization—which is why it’s essential to monitor Geronimo and Tomcat server performance metrics to proactively catch issues negatively affecting performance.
Third-party Geronimo and Tomcat monitoring tools are designed to provide high-level visibility to server performance by providing visualized metrics allowing for quick parsing of data trends and potential pain points.
By giving IT admins access to comprehensive information about the performance of Java application servers (and potentially non-Tomcat servers as well), Geronimo and Tomcat monitoring tools can help ensure better end-user experience while freeing up your time to devote to more mission-critical tasks.
Apache monitoring tools can make it easier to keep track of Java applications in production, which has the added benefit of giving administrators insights into potential issues before they occur. Without the insights into pattern detection Geronimo and Tomcat monitoring provides, it becomes much more difficult to identify the cause of issues. For instance, low memory can cause a JVM to slow down considerably. This in turn causes the performance of whatever applications the JVM is running to also slow down.
SolarWinds SAM is built to provide Geronimo and Tomcat server monitoring software built to work right out of the box, including application monitoring for components from Tomcat servers and applications to virtual layers and other business-critical applications like SQL Server, Exchange, and Active Directory.
SAM gives you the ability to customize alerts, reports, and dashboards to fit the needs and preferences of your organization, whether you’re supporting a small business or an enterprise. SAM server monitoring software can be used to collaborate across server, web, database, and application teams, allowing you to use baselines to compare application performance and create more accurate and useful alerts for when apps start having issues. Plus, you can establish custom thresholds for the various counters used to track performance metrics.
SAM monitors several server components, including Geronimo application server and Tomcat memory usage monitoring metrics like:
In addition to the other server monitoring capabilities it provides, SAM is designed to be a robust and comprehensive Geronimo and Tomcat monitoring tool built to combine monitoring, reporting, alerting, and asset inventory in one solution.
Server & Application Monitor
Automatic application discovery and server monitoring.
Quickly monitor the performance and availability of Microsoft Azure and Amazon AWS services.
Built-in templates provide best practices.