- Events
-
Partners
- Government
- Customer Portal
- Contact Us
- Contact Sales
-
English
SolarWinds Observability delivers unified and comprehensive visibility for cloud-native, custom web applications to help ensure optimal service levels and user satisfaction with key business services.

Eliminate Tool Sprawl and gain comprehensive, single-pane-of-glass visibility with actionable intelligence
Accelerate issue resolution with built-in intelligence and actionable insights driven by data from across the environment
Reduce alert fatigue with AIOps, machine learning (ML), and a customized metrics -powered solution designed to automatically prioritize and surface real problems
Accelerate cloud modernization with cloud-native, multi-tenant observability that seamlessly integrates with SolarWinds Hybrid Cloud Observability to deliver a unified view across multi-cloud, hybrid, and on-premises environments
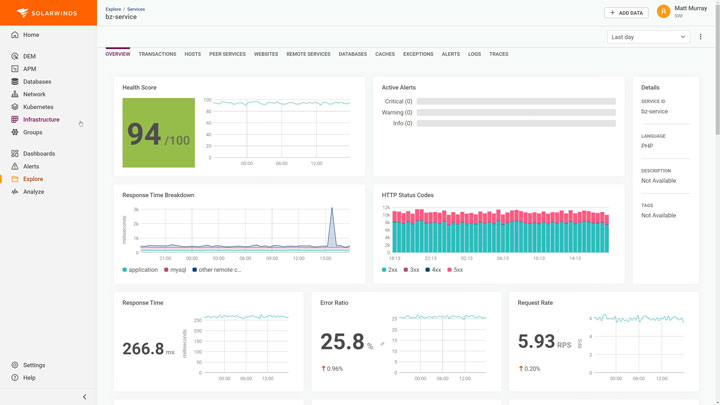
Comprehensive application observability goes beyond basic metrics, traces, logs offerings. It combines application performance metrics with distributed tracing and leverages log monitoring capabilities along with AIOps-driven notifications—and supports cloud-native open-source frameworks and third-party integrations. Application observability helps ensure the availability and performance of cloud-native custom applications and microservices. With application observability you can:
Infrastructure observability helps ensures the health and performance of cloud-based resources, including VMs, storage, hosts, containers, and serverless and cloud service providers. Integration with AI-powered analytics and application and log observability combine to deliver context-rich intelligence to help you proactively identify and resolve performance issues. With infrastructure observability, you can:
Log observability provides scalable, full-stack, multi-source log management, combining wide support, powerful search, AI-driven analytics, and built-in integration with application and infrastructure observability to deliver context-rich intelligence to help teams troubleshoot smarter and faster.
Database observability provides deep performance monitoring to diagnose and analyze issues, using sophisticated root cause analysis. Get comprehensive visibility into your database instances to help increase system performance and team efficiency while helping ensure infrastructure cost savings.
ML-based AIOps and health scores based on golden metrics quickly highlight issues. Get full-stack observability by correlating database metrics with the application performance, distributed tracing, and log monitoring capabilities of SolarWinds Observability.
Database observability simplifies the complexity of managing multi-vendor environments by providing support for databases such as MySQL, PostgreSQL, Microsoft SQL Server, AWS Aurora (PostgreSQL, MySQL), AWS RDS (PostgreSQL, MySQL), MongoDB, MongoDB Atlas, and Redis, so you can:
Digital experience observability enables DevOps teams to optimize the customer experience of web applications. Granular, real-time performance data, combined with AI-powered analytics, delivers deep insights into application performance impacts on the end user experience. Armed with this intelligence, DevOps team can experience the application the way the customer does—and make better design and implementation choices.
Network observability helps enable troubleshooting of the availability, health, and performance of on-premises networks and end-to-end connections to public cloud networks through the collection and analysis of diverse network metrics and logs. With network observability, organizations can more easily understand and visualize the overall picture of how the network is impacting the services and experiences depending on it. With network observability, you can:
*USD per month, billed annually