- Events
-
Partners
- Government
- Customer Portal
- Contact Us
- Contact Sales
-
English
Download, install, automatically discover your environment, and start monitoring in about an hour with help from SAM's simple server monitoring tool. No professional services required.
Monitor the IaaS, PaaS, and SaaS services for Amazon Web Serices (AWS) and Microsoft Azure. Provide end-to-end systems performance and application monitoring using agent and agentless-based technologies for application, systems, and service metrics.
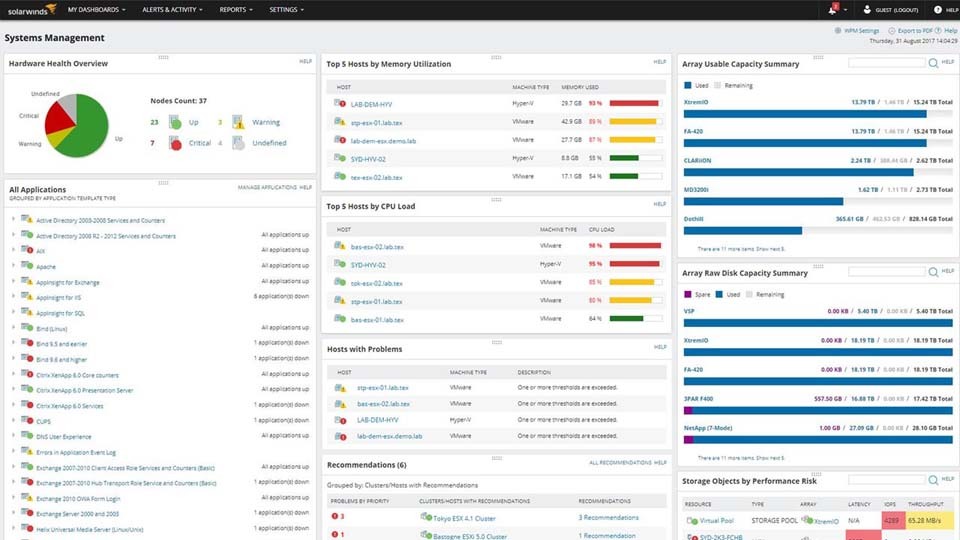
Systems and application performance monitoring and troubleshooting templates for 1,200+ supported applications, systems, and infrastructure such as:
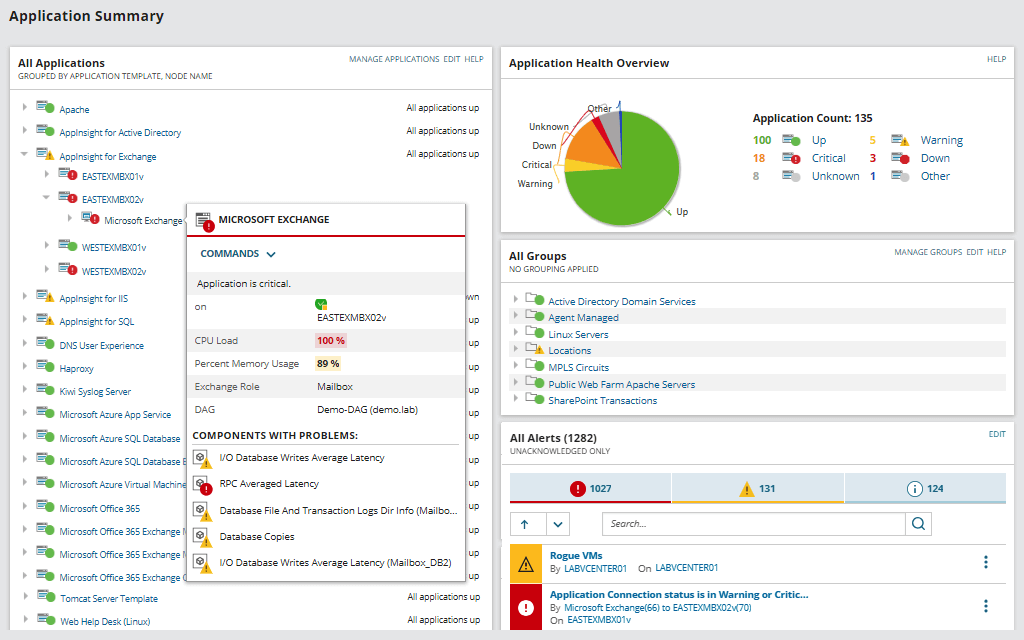
Get more in-depth application monitoring with AppInsight™ dashboards for Active Directory, Exchange, Microsoft IIS, and SQL Server.
View code-level application performance level detail with Application Performance Monitor integration.
Create custom monitors, modify built-in templates, and import your existing custom scripts in just a few clicks. We know that every IT environment is different, which is why SAM server monitoring is designed to allow you to monitor any service, process, or application, regardless of whether it’s a commercial or a custom application.
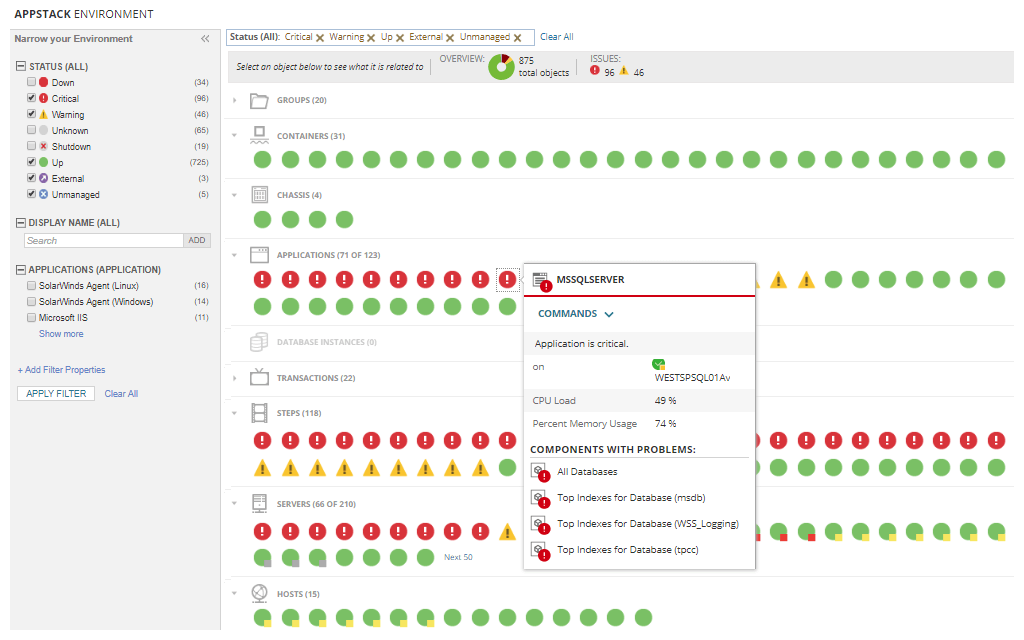
With the AppStack™ dashboard, you can quickly see infrastructure dependencies and pinpoint the root cause of application issues within physical and virtual server environments. Identify where application issues originate typically in just a few seconds.
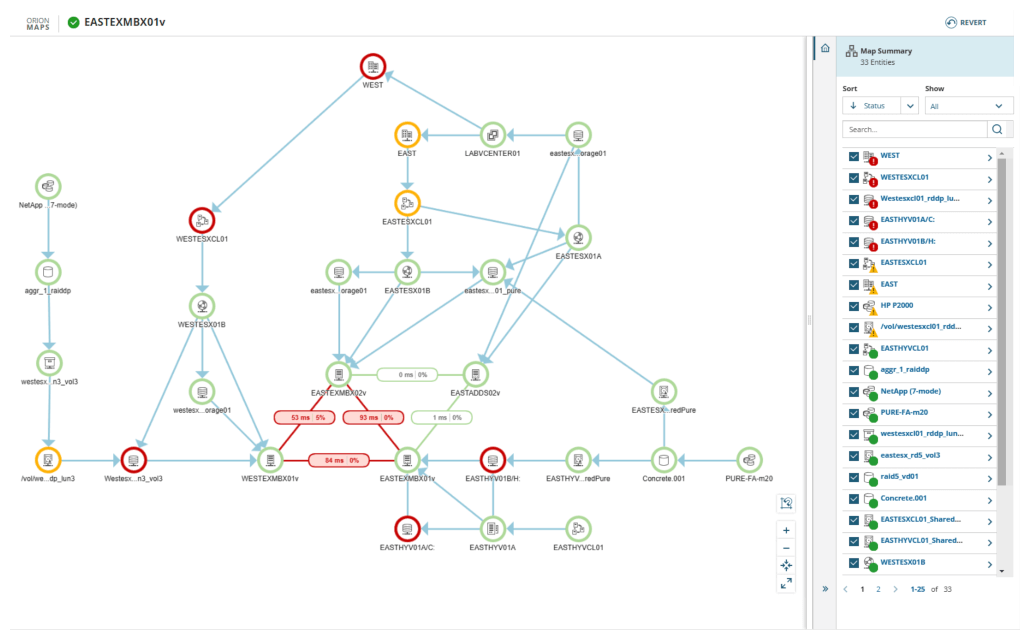
Automatically discover and visualize network-based relationships between applications and servers. Examine and monitor inbound and outbound network connections and analyze metrics, including latency and packet loss. Visualize individual application or server connections, or view a complete map of application dependencies of multiple application, servers, and infrastructure connections to determine if network communication issues are affecting business-critical applications.
Reduce alert fatigue with custom alert thresholds, or use the dynamic baselines feature to set alert thresholds and define “what’s normal”. Create server monitoring alerts based on simple or complex nested trigger conditions, defined parent/child dependencies, and more. Use one of the hundreds of built-in reports, or create your own using the web-based interface to fit your business needs.
Monitor the health and availability of virtual hosts and guests alongside physical servers. Integration with SolarWinds® Virtualization Manager provides deeper insight to troubleshoot virtualization issues.
Monitor server storage volumes, disk usage, and capacity metrics out of the box. Integration with SolarWinds Storage Resource Monitor provides deeper insight to troubleshoot storage issues in SAN and NAS environments.
The PerfStack™ dashboard included with SAM server monitoring software can enable you to drag, drop, and overlay performance metrics from your systems data and multiple sources (such as network, virtualization, or storage), and view data types on a single chart.
Integrates with other Orion® Platform-powered products for unified server monitoring and deeper insight into web performance, storage, network, database, and virtualized resources. Reduce false positives with intelligent baseline alerting. The Orion Platform can also allow you to easily customize built-in alerts and reports as needed.
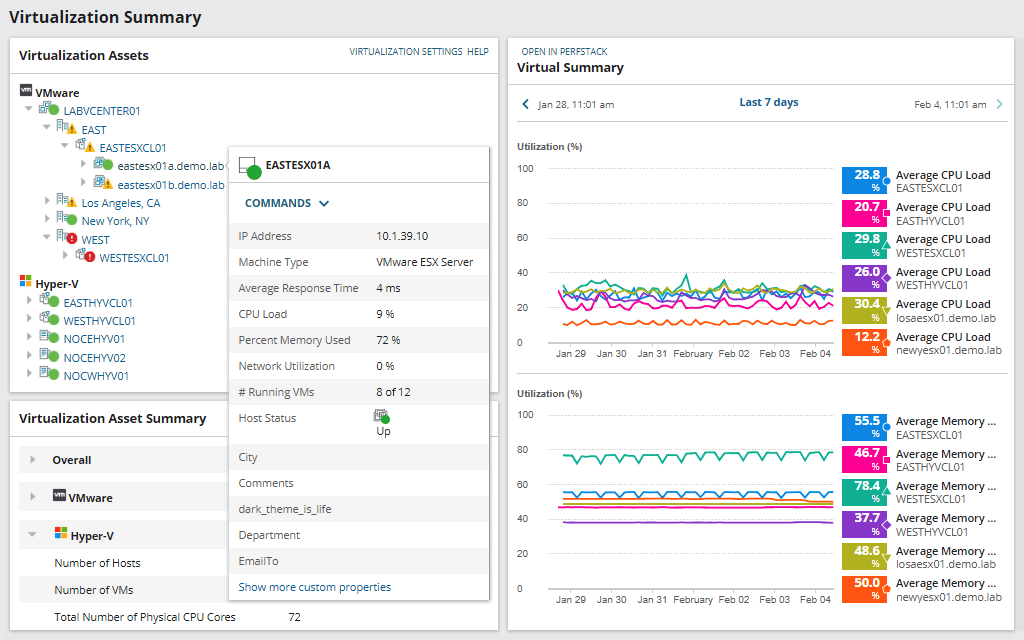
Gain insight into the performance, capacity, and usage of your virtualized infrastructure, including hosts, VMs, clusters, containers, vSANs, and other datastores. VMAN's VM monitoring software can help remediate virtual machine issues with built-in management actions without needing to log in to a hypervisor.
Actionable Intelligence can allow for single-click remediation of active and predicted recommendations to optimize virtual machine performance and resource allocation.
Recommendations can be individually selected or multi-selected to be run immediately or scheduled to run at a later date and time.
Power off idle VMs and delete powered-off VMs, orphaned VMDK files, and snapshots to reclaim resources with Virtualization Manager’s VM sprawl control management tool.
Predict CPU, memory, network, and storage needs for VMware vSphere and Microsoft Hyper-V. Run modeling scenarios to learn how best to support new workload, or run a checkup to ensure your resources are in alignment with current usage.
Quickly monitor and report on vSAN capacity and performance. View dedup and compression, before and after statistics, free space, overallocated ratios, and more to help ensure you have the necessary capacity. Gain visibility into clusters performance with failed health check monitoring and VM latency breakdown.
Monitor and manage IaaS services for Amazon EC2 instances and Microsoft Azure VMs from the same console as your on-premises virtualization environment.
Quickly assess the health of your entire environment—whether it’s server, virtual, or storage infrastructure—and troubleshoot specific, interrelated problems from one view.
SolarWinds VMAN virtual machine monitoring tool is built to provide near real-time event correlation, alerting, reporting, and performance monitoring for VMware environments. Using VMAN’s PerfStack™ feature, you can speed root cause analysis by correlating performance spikes to events such as VM migrations, creation, and configuration changes.
Uncover and resolve issues unique to vSphere, Hyper-V, Azure, and AWS using intuitive dashboards and alerts with clickthrough to greater detail. Active virtualization alerts are categorized as critical, serious, warning, and informational. Performance, storage, and capacity planning dashboards allow you to quickly focus on the task at hand.
The PerfStack dashboard within VMAN’s virtual machine monitor software allows you to drag, drop, and overlay VM management tool performance metrics from your systems data and multiple sources (network, virtualization, storage, or database), and view data types on a single chart.
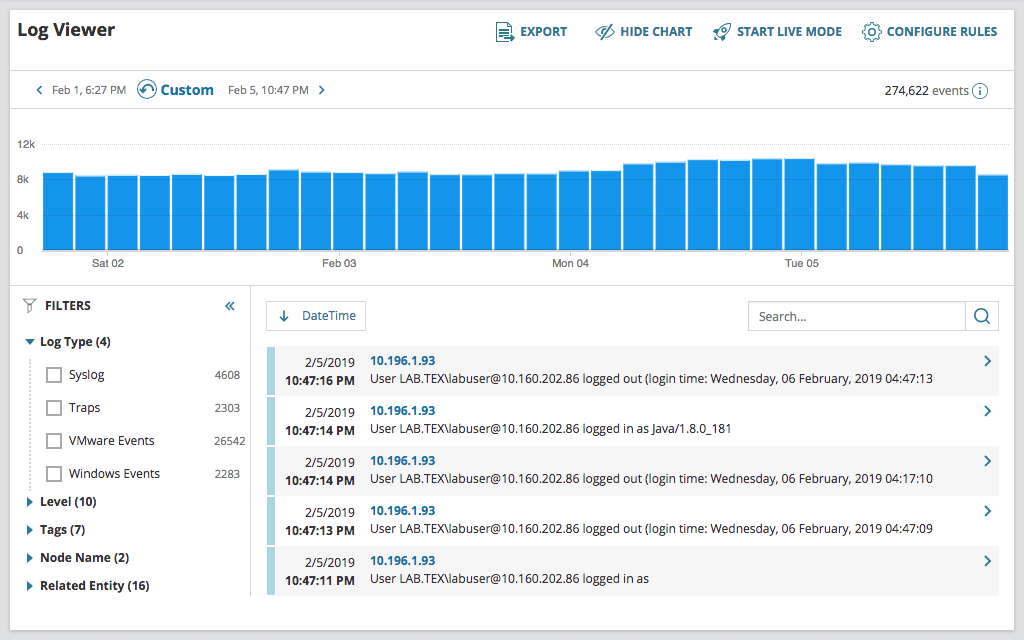
Your infrastructure is constantly generating log data to provide performance insight. Collect, consolidate, and analyze thousands of syslog, traps, Windows, and VMware events to perform root-cause analysis with log monitoring tools from Log Analyzer.
Perform searches using basic matching. Execute searches using multiple search criteria and apply filters to narrow results. Save, schedule, and export search results within the log monitoring software.
Traditional log collection and log management tools generate reports in plain text or HTML. SolarWinds® Log Analyzer displays logs in an interactive, real-time log stream.
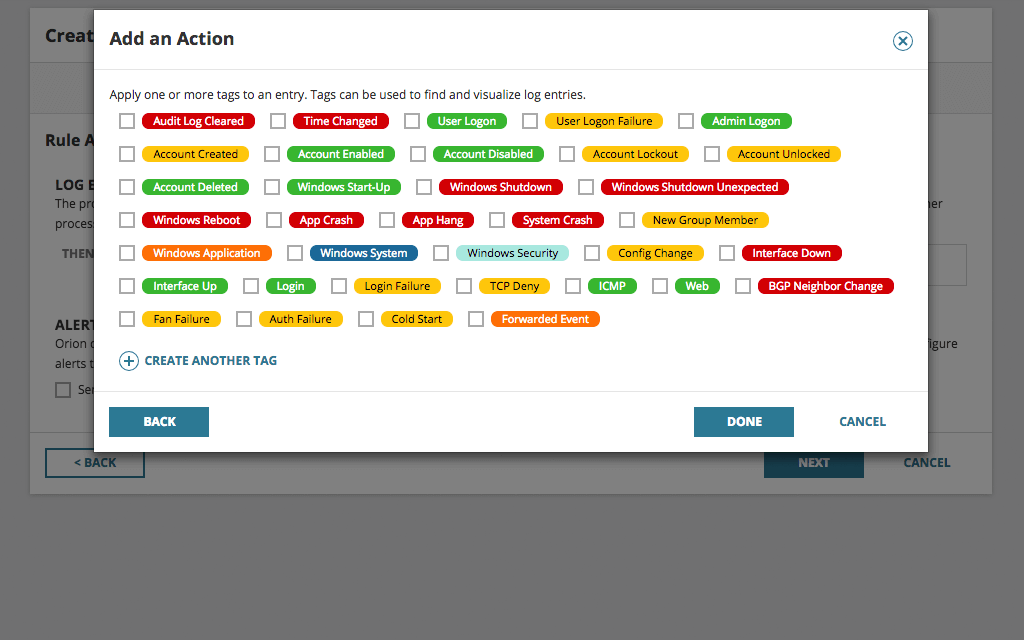
Easily apply (color-coded) tags to your log data to aid with filtering, searching, and identifying performance issues.
Log Analyzer can collect Windows flat log files and provide insight to help admins troubleshoot and resolve application issues faster.
SolarWinds Log Analyzer directly integrates your log and event data into the Orion Platform console so you can easily view log data alongside network and systems performance.
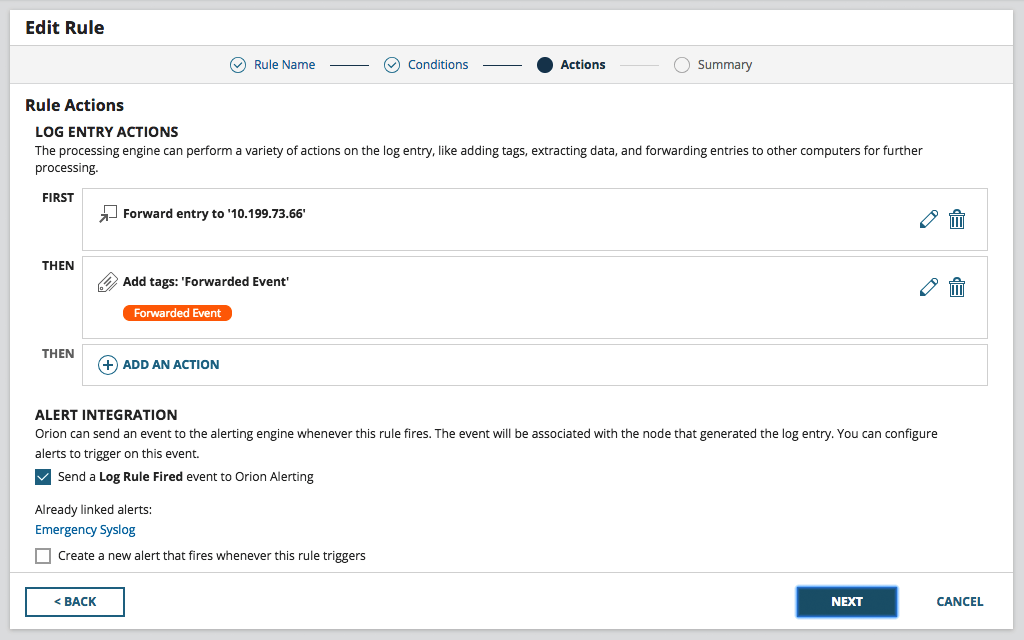
Be the first to know when issues arise. Log Analyzer integrates with the intelligent alert engine of Orion to provide customizable alerts along with delivery options including email notification, ServiceNow integration, and the triggering of an external script.
Having your log data in a central location is great for troubleshooting and correlation, but what if you need that useful data in other locations or tools? Log Analyzer allows you to forward logs to other applications, such as ticketing systems or SIEMs, and export log data to CSV files for even more flexibility.
System and application configurations are changing constantly. Some changes are necessary and authorized, while others may be malicious or done outside normal processes. One thing they all have in common is they’re often the cause of outages, performance issues, or vulnerabilities. However, knowing when these changes took place and who made the change without a configuration change monitoring tool is nearly impossible.
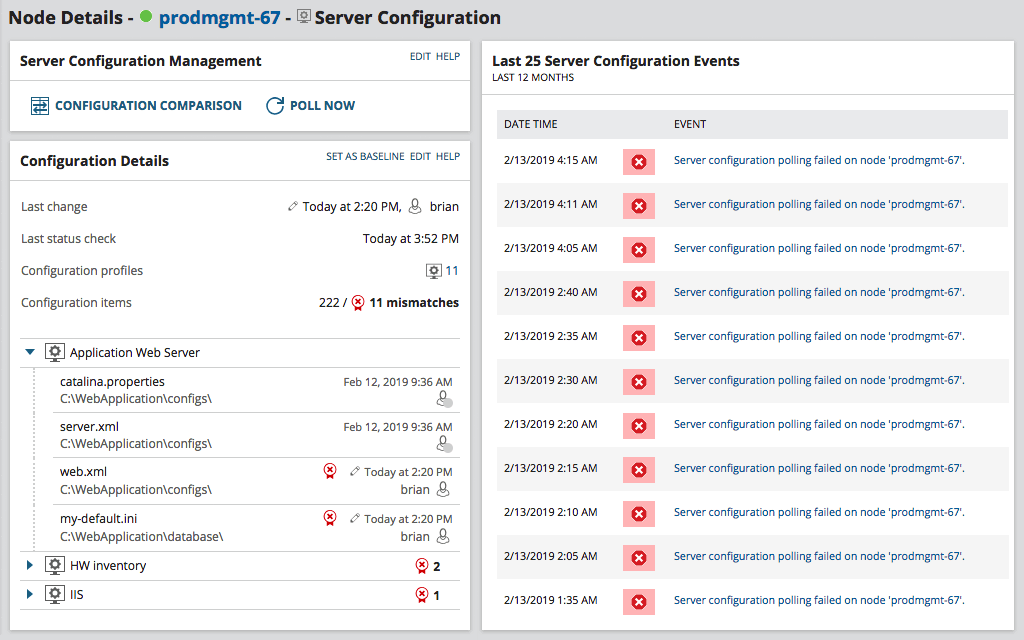
SolarWinds® Server Configuration Monitor (SCM) is designed to track and alert you when system and application configs change from a user-defined baseline or their last configuration. With agent-based monitoring on Windows and Linux devices and applications, you’ll see changes in near real time and who made changes to files and the registry.
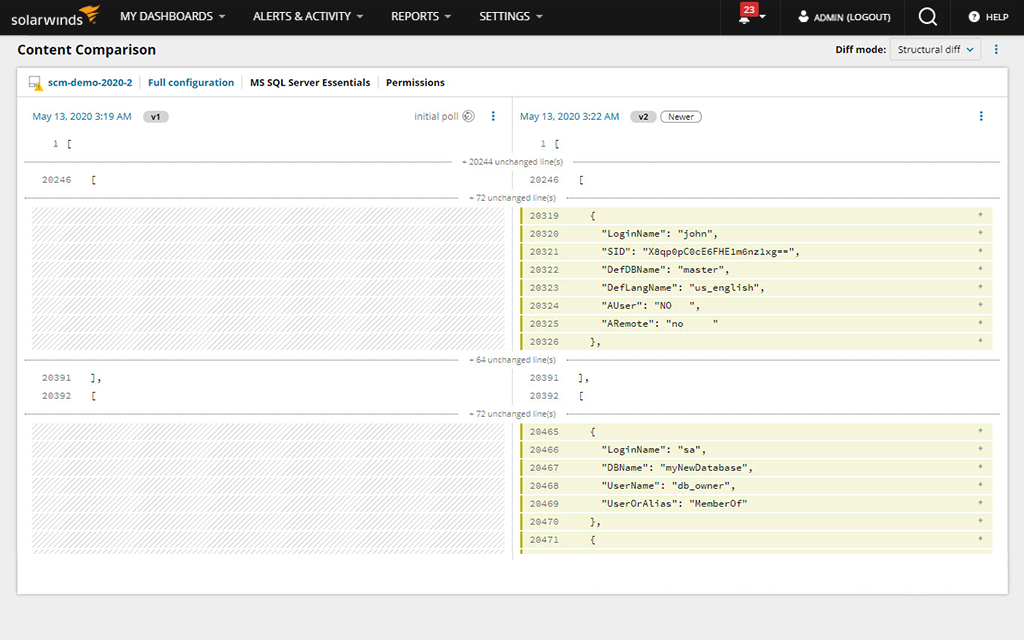
Your databases are mostly behind the scenes, but they’re critical to keeping your business running. SCM monitors for configuration changes to this infrastructure, and changes to user permissions and schemas.
When a server is down or performing poorly, the change data collected by Server Configuration Monitor can be combined with the performance, health, and availability metrics collected by other Orion® Platform-based modules in a single visual timeline via PerfStack™. The combination of these two sets of data allows you to easily see if an application or server configuration change was the source of a performance issue or outage.
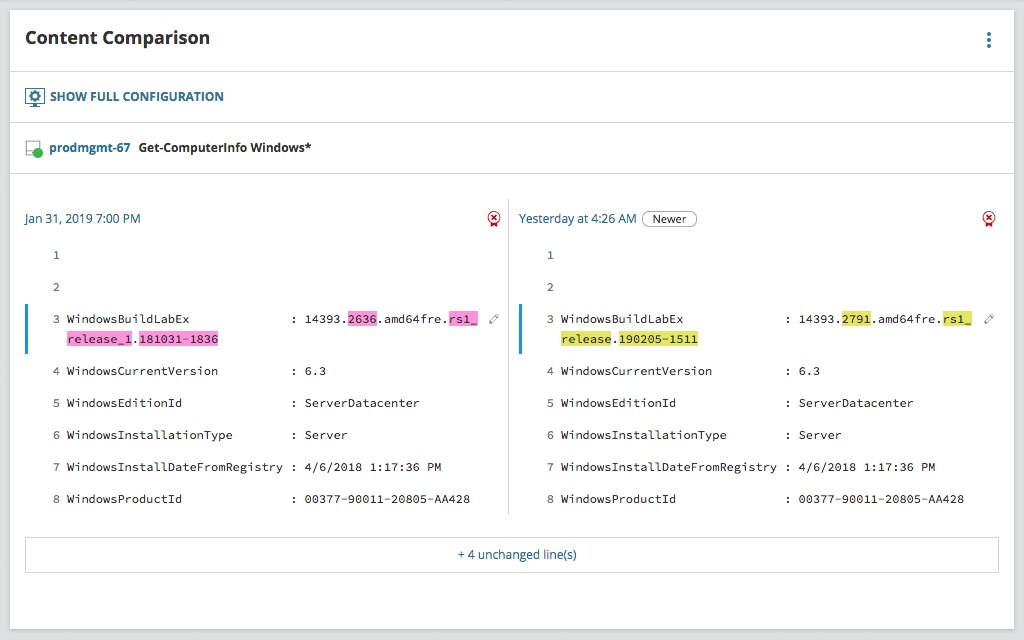
Homegrown scripts provide valuable insight into your organizations systems and applications. With SCM, you can centrally manage scripts, distribute those scripts to servers in your environment, and then track and alert on changes to the entire output of those scripts. Essentially expanding your change monitoring capacity to the level of your scripting prowess.
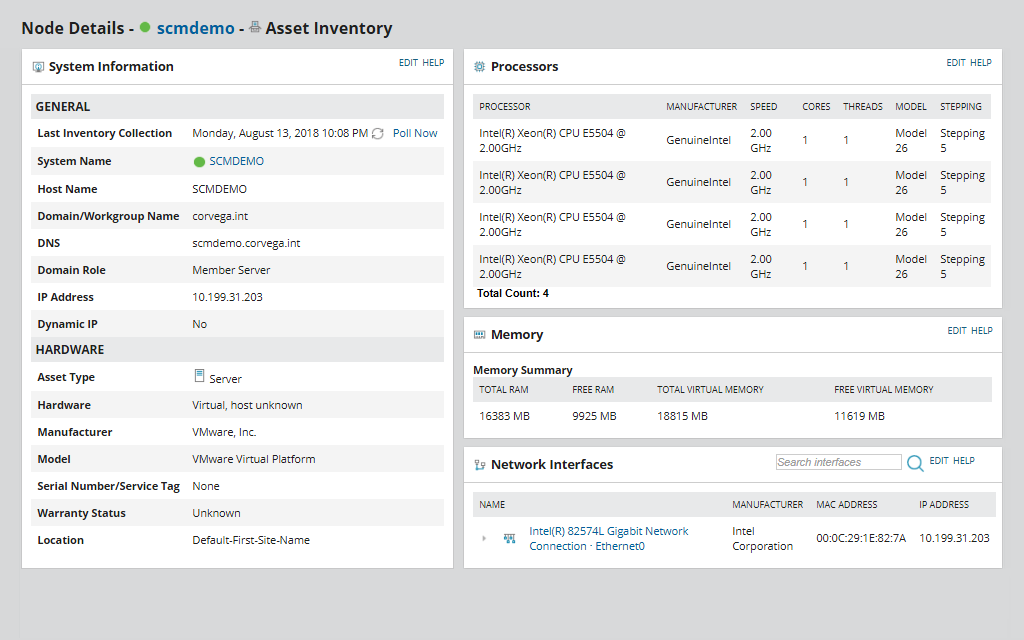
Gain better control of your hardware and software inventory with Server Configuration Monitor’s asset inventory tool. It’s designed to provide you with an up-to-date list of your hardware and software assets.
Built on the Orion Platform, Server Configuration Monitor has direct access and integration with other enterprise level features and datasets.
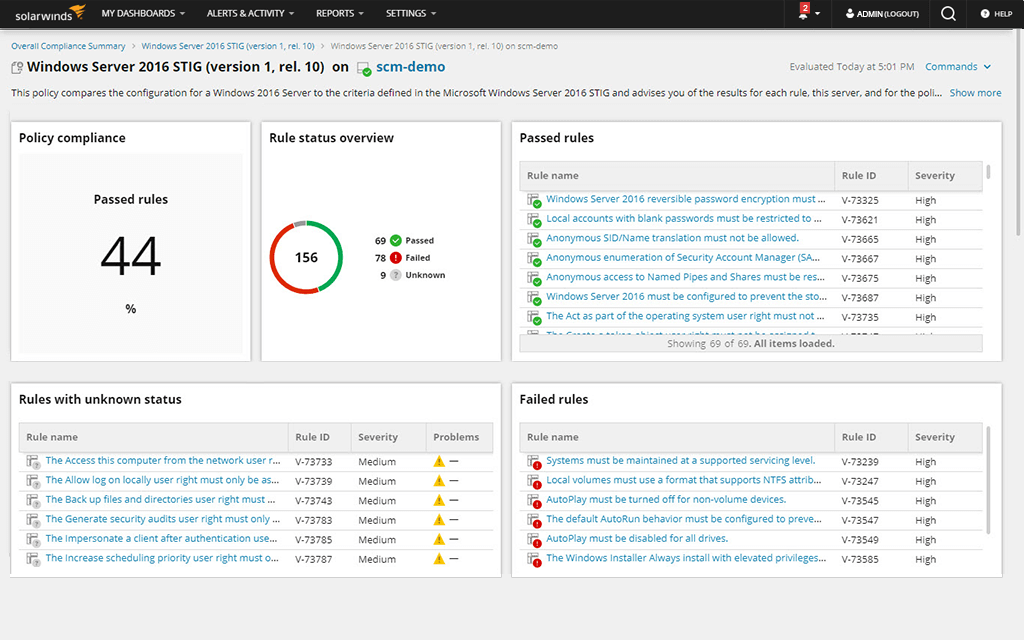
Each rule reads a configuration from a file, device, command, registry setting, etc.; pulls the needed information; evaluates it against the benchmark; and returns pass, fail, or unknown.
Systems and application performance monitoring and troubleshooting templates for 1,200+ supported applications, systems, and infrastructure such as:
Get more in-depth application monitoring with AppInsight™ dashboards for Active Directory, Exchange, Microsoft IIS, and SQL Server.
View code-level application performance level detail with Application Performance Monitor integration.
Actionable Intelligence can allow for single-click remediation of active and predicted recommendations to optimize virtual machine performance and resource allocation.
Recommendations can be individually selected or multi-selected to be run immediately or scheduled to run at a later date and time.
Traditional log collection and log management tools generate reports in plain text or HTML. SolarWinds® Log Analyzer displays logs in an interactive, real-time log stream.
Log Analyzer can collect Windows flat log files and provide insight to help admins troubleshoot and resolve application issues faster.
SolarWinds Log Analyzer directly integrates your log and event data into the Orion Platform console so you can easily view log data alongside network and systems performance.
System and application configurations are changing constantly. Some changes are necessary and authorized, while others may be malicious or done outside normal processes. One thing they all have in common is they’re often the cause of outages, performance issues, or vulnerabilities. However, knowing when these changes took place and who made the change without a configuration change monitoring tool is nearly impossible.
SolarWinds® Server Configuration Monitor (SCM) is designed to track and alert you when system and application configs change from a user-defined baseline or their last configuration. With agent-based monitoring on Windows and Linux devices and applications, you’ll see changes in near real time and who made changes to files and the registry.
Your databases are mostly behind the scenes, but they’re critical to keeping your business running. SCM monitors for configuration changes to this infrastructure, and changes to user permissions and schemas.
When a server is down or performing poorly, the change data collected by Server Configuration Monitor can be combined with the performance, health, and availability metrics collected by other Orion® Platform-based modules in a single visual timeline via PerfStack™. The combination of these two sets of data allows you to easily see if an application or server configuration change was the source of a performance issue or outage.
Homegrown scripts provide valuable insight into your organizations systems and applications. With SCM, you can centrally manage scripts, distribute those scripts to servers in your environment, and then track and alert on changes to the entire output of those scripts. Essentially expanding your change monitoring capacity to the level of your scripting prowess.
Gain better control of your hardware and software inventory with Server Configuration Monitor’s asset inventory tool. It’s designed to provide you with an up-to-date list of your hardware and software assets.
Built on the Orion Platform, Server Configuration Monitor has direct access and integration with other enterprise level features and datasets.

Comprehensive server and application monitoring made simple

Virtual machine monitoring and management designed to resolve performance issues.

Easily investigate machine data to help identify the root cause of IT issues faster

Gain visibility into systems changes and easily compare configurations over time with our new change monitoring tool
Having all the products will give you the most information, but you can start with a couple of products and add as needed.
Here is some information to get you started.
Get visibility into network storage and resource reporting capabilities today.