- Events
-
Partners
- Government
- Customer Portal
- Contact Us
- Contact Sales
-
English
Hardware resource bottlenecks not only affect application and server uptime, but they can be a symptom of overall poor server performance. SolarWinds® Server & Application Monitor (SAM) is built to monitor your most important hardware resources to help you see where resources may be spread too thin and where you run the risk of downtime.
SAM is also designed to monitor the key metrics you need to better understand overall server health. For example:
With insight into these metrics and more, it’s possible to both optimize server health and plan to ensure continued service uptime.
Hardware health is an important part of maintaining high uptime and availability in your system. SolarWinds Server & Application Monitor can help you start monitoring your multi-vendor server hardware health to help you make sure hardware isn’t causing downtime.
Proactive server health monitoring for key indicators can allow you to fix problems before they become severe. With SAM, you can view key hardware health metrics, such as fan speed, power supply, and server temperature, to better gauge the health of your hardware and ensure any performance issues you may be facing aren’t the result of old devices.
Monitor application performance and hardware health, along with your routine scheduled tasks, and get real-time visibility into task completion, all from a single uptime tracker dashboard. With the server uptime monitoring tools in SAM, you can also easily restart or stop services to resume website or web app availability.
Access over 200 out-of-the-box apps and manage all your critical business applications using SolarWinds SAM, including tracking uptime and downtime for:
Server uptime is a key measurement of the functionality of your system. Server uptime refers to server status, which can indicate if it’s fully available and functional. When looking at sever health, uptime is defined by the availability of a website or domain or by the availability and reliability of devices and servers. It’s contrasted with server downtime, when a server is experiencing failures and isn’t available or useable.
In the most basic terms, server uptime refers to when the system is working and is generally considered the default, whereas server downtime refers to when the system isn’t working. Downtime can be broken down into more specific definitions, since it can be intentional (such as downtime for system maintenance) or unintentional (like a crisis in the system or if there’s a malfunction or error causing the system to become unavailable).
Checking server uptime is important when determining if devices are performing as they should. In a large network, this understanding is also a critical part of monitoring server functionality and how they affect the availability of the services you use.
While you can check server uptime manually, the more devices and nodes you have on your system, the more difficult checking server uptime across your environment can become. However, the basics of manually checking each server for its uptime are similar across operating systems:
In Windows, you can check server uptime using either the net statistics server command or the systeminfo command. To use either of these commands, use the following steps:
Another way to check server uptime in Windows is through the Task Manager:
In Linux, you can check server uptime by following these steps:
While it’s possible to check each server uptime manually, manual server uptime monitoring can be a tedious process, wasting both time and energy while producing few useful, applicable results. The breadth of information you can discover about your network when conducting manual uptime monitoring is far smaller than what you can gain using server uptime monitoring tools.
Investing in server uptime monitoring software can help you make the most out of uptime monitoring insights. Using SolarWinds Server & Application Monitor, you can monitor server uptime across your environment with integrated templates designed to let you monitor over 1,200 applications, operating systems, and devices in your network to help make sure your systems and services are performing optimally.
Server uptime monitoring consists of monitoring and measuring statistics and data across your environment, including hardware resources and health, services, and processes. One of the central components of server uptime monitoring is monitoring server hardware health and resources. This is because hardware bottlenecks can affect server and application uptime and server performance.
The main metrics to watch when monitoring hardware health include:
Ideally, a server uptime tool can let you monitor application health alongside hardware health from a single, easy-to-understand dashboard. This information can then be used to gain insights about the performance of different aspects of your system health, so you can better understand the overall availability of your servers.
Uptime monitoring helps ensure your system is performing as expected. It can also help you solve server performance problems as they come up—ideally before they have a serious impact on the productivity of end users.
Through system availability monitoring, you can aim to achieve high availability (HA) for the system. HA is defined as the ability of a system, or a component of a system, to remain functional for a substantial length of time.
Monitoring processes and services is also an important component of server uptime monitoring. Stopped services and rogue processes can use up your server hardware resources without your knowledge, which can reduce your system performance. Monitoring uptime lets you find these resource hogs and stop them before they cause too much damage.
Server uptime monitoring tools are built to allow you to better protect the continued functionality of your business by helping you pinpoint problems in your system, whether in the hardware, website, or application on your network. An uptime monitor is designed to help you better prevent downtime and find the root causes of performance failures before they cause significant damage. Server monitoring software can also work as a downtime monitor tool or uptime tracker by constantly checking for any issues with an impact on performance, which can help you bring your downtime as close to zero percent as possible and maximize the availability of your system.
Depending on the server, the work done by an uptime monitor can look a little different. This includes:
Additionally, server uptime monitoring software can let you see how many users are trying to access your applications and servers at the same time during peak business hours. This can help you understand resource utilization and allocation, and if system resources are affecting the performance of your applications, so you can load balance appropriately.
Server uptime monitoring software can also send real-time alerts when performance issues are first detected, which can help you determine if your services are providing the amount of uptime guaranteed by service level agreements.
SolarWinds Server & Application Monitor is built to monitor the pieces of your system necessary for maximizing uptime, including both hardware and software. SAM can help you find the root cause of a system failure by providing deep insights into your server to give you the information you need to act immediately, so you can solve it before end users are impacted. This includes indicating whether problems may be due to the web server needing more resources, an issue with the network, problems with the application, or any number of other potential causes.
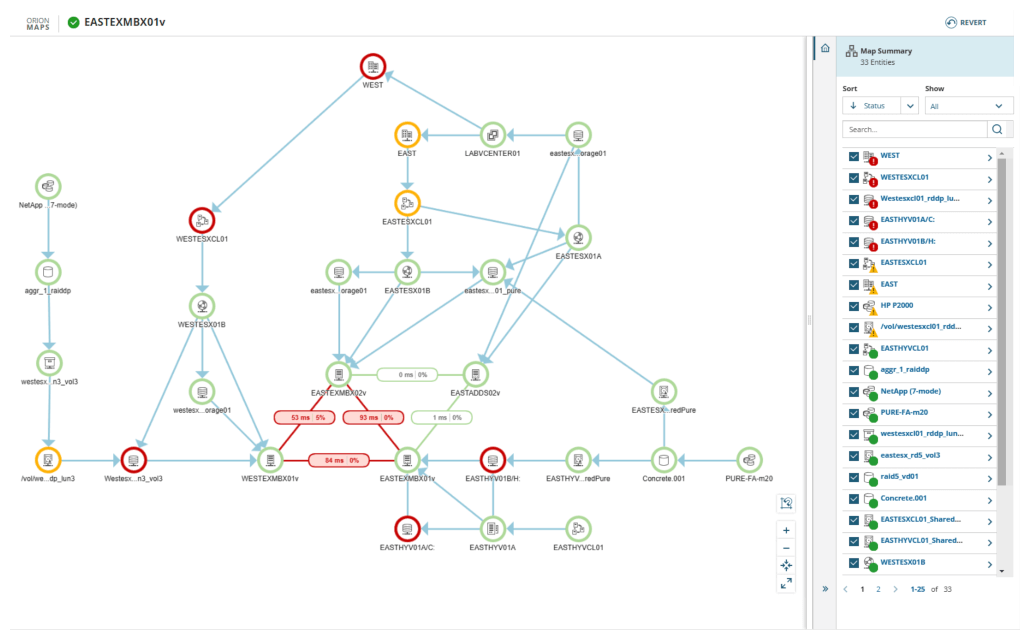
SAM also comes with the AppStack™ dashboard, which can help you solve problems quickly by mapping dependencies across storage systems, applications, and physical and virtual servers to help you better understand complex environments. Using AppStack, you can pull in data like inbound and outbound network connections alongside SAM application monitoring metrics to achieve a more complete view of overall system health. SAM visualization benefits also include PerfStack™, which lets you correlate data across a single chart by dragging, dropping, and stacking performance metrics to help you solve the most complex infrastructure problems.
SolarWinds SAM is designed to monitor every part of your system, including IaaS, PaaS, and SaaS applications within Azure and AWS. SAM also lets you customize your server monitoring, so you can ensure you’re not overrun with unnecessary alerts, but instead get information on the issues affecting the specific needs of your system. While you can easily customize your server monitoring, SAM comes with over 1,200 pre-created application monitoring templates to help ensure you get real-time alerts whenever the uptime monitor detects a potential issue with your system. SolarWinds Server & Application Monitor is built to support your efforts to improve server uptime, so you can experience as close to the ideal 100% uptime as possible.
Server uptime is a key measurement of the functionality of your system. Server uptime refers to server status, which can indicate if it’s fully available and functional. When looking at sever health, uptime is defined by the availability of a website or domain or by the availability and reliability of devices and servers. It’s contrasted with server downtime, when a server is experiencing failures and isn’t available or useable.
In the most basic terms, server uptime refers to when the system is working and is generally considered the default, whereas server downtime refers to when the system isn’t working. Downtime can be broken down into more specific definitions, since it can be intentional (such as downtime for system maintenance) or unintentional (like a crisis in the system or if there’s a malfunction or error causing the system to become unavailable).
Checking server uptime is important when determining if devices are performing as they should. In a large network, this understanding is also a critical part of monitoring server functionality and how they affect the availability of the services you use.
While you can check server uptime manually, the more devices and nodes you have on your system, the more difficult checking server uptime across your environment can become. However, the basics of manually checking each server for its uptime are similar across operating systems:
In Windows, you can check server uptime using either the net statistics server command or the systeminfo command. To use either of these commands, use the following steps:
Another way to check server uptime in Windows is through the Task Manager:
In Linux, you can check server uptime by following these steps:
While it’s possible to check each server uptime manually, manual server uptime monitoring can be a tedious process, wasting both time and energy while producing few useful, applicable results. The breadth of information you can discover about your network when conducting manual uptime monitoring is far smaller than what you can gain using server uptime monitoring tools.
Investing in server uptime monitoring software can help you make the most out of uptime monitoring insights. Using SolarWinds Server & Application Monitor, you can monitor server uptime across your environment with integrated templates designed to let you monitor over 1,200 applications, operating systems, and devices in your network to help make sure your systems and services are performing optimally.
Server uptime monitoring consists of monitoring and measuring statistics and data across your environment, including hardware resources and health, services, and processes. One of the central components of server uptime monitoring is monitoring server hardware health and resources. This is because hardware bottlenecks can affect server and application uptime and server performance.
The main metrics to watch when monitoring hardware health include:
Ideally, a server uptime tool can let you monitor application health alongside hardware health from a single, easy-to-understand dashboard. This information can then be used to gain insights about the performance of different aspects of your system health, so you can better understand the overall availability of your servers.
Server & Application Monitor
Easily check server uptime and track key performance metrics.
Use an uptime tracker to monitor hardware health and resources.
Choose an uptime monitoring tool offering robust alerting.