- Events
-
Partners
- Government
- Customer Portal
- Contact Us
- Contact Sales
-
English
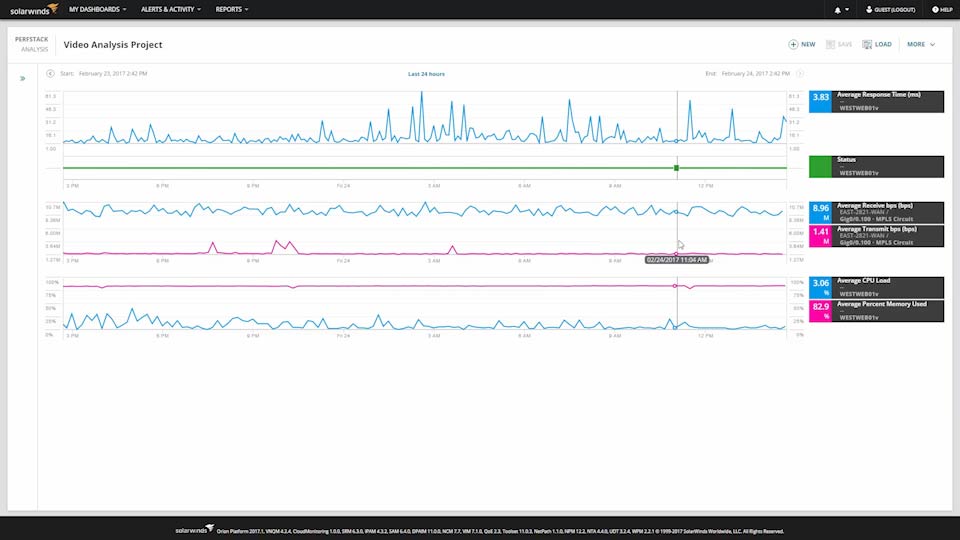
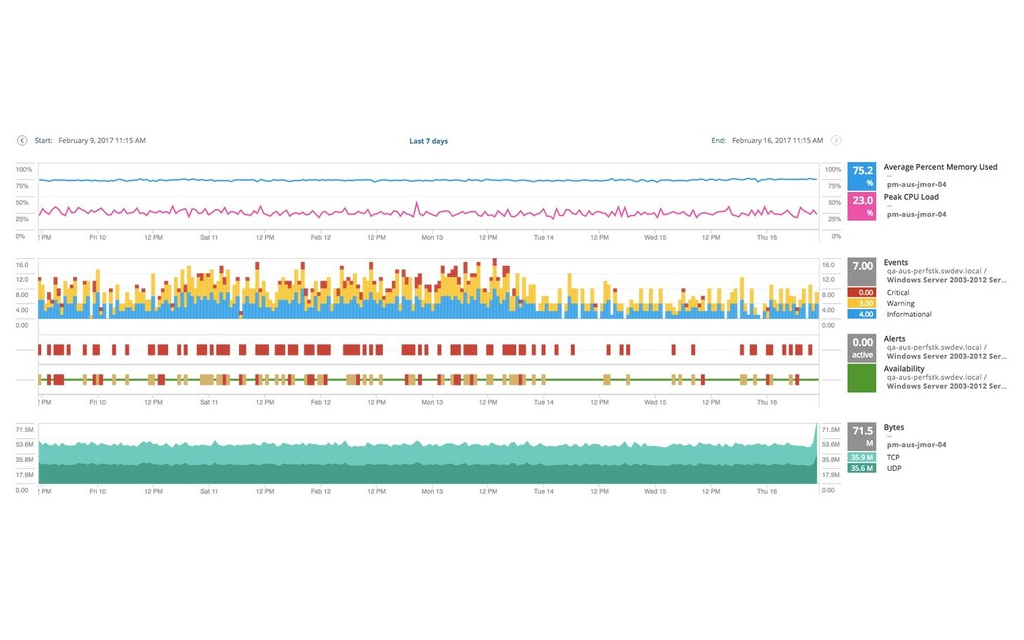
Drag, drop and overlay performance metrics from multiple sources and data types on a single chart.
See your data on a common timeline whether it’s the network, systems, virtualization, database, or storage.
Share data from the entire IT stack across teams and reduce finger pointing.

Multi-vendor network monitoring built to scale and expand with the needs of your network.

Real-time network utilization monitoring tool, NetFlow analyzer, and bandwidth monitoring software.

Comprehensive server and application monitoring made simple

Storage resource management and reporting for health, performance, and capacity of multi-vendor storage.

Virtual machine monitoring and management designed to resolve performance issues.

Website monitoring software built to find and fix internal and external site and app performance issues
Our product specialists are on-call to help you make the right choice.