- Events
-
Partners
- Government
- Customer Portal
- Contact Us
- Contact Sales
-
English
Browse IP address ranges to collect network information and produce a detailed device inventory.
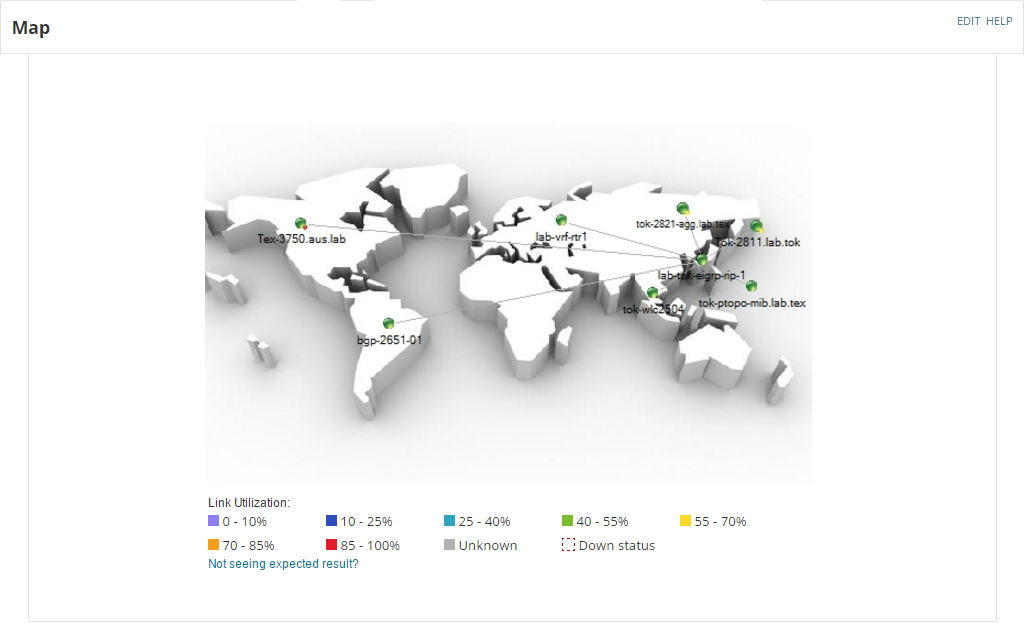
An IP browser allows you to automatically map network topology for quality network visualization.
Browse IP address ranges and poll device MIBS to obtain fault, availability, and performance metrics.
A network browser uses the simple network management protocol (SNMP) to browse a network for connected devices. By sending requests and getting responses, the SNMP protocol identifies information like system details, routing information, device failures, and other key metrics.
By gathering information about the network and its nodes, a LAN browser helps automate LAN monitoring tasks like conducting discovery and mapping and running fault, availability, and performance scans. The SNMP protocol can also detect specific trigger conditions or anomalies across a network to enable immediate alerts.
A network browser is a critical tool for admins managing business networks, especially large or dynamic networks. An IP network browser ensures added devices don’t go undetected, and provides valuable, ongoing insight into key performance metrics. By polling devices on an automated, ongoing basis, a network browser offers admins real-time insights into their IT environment, enabling faster troubleshooting.
NPM’s network browsing feature identifies the status of devices across your network so you can better assess their impact on network performance. NPM contains a management information base (MIB) browser that enables the SNMP protocol to capture object identifiers (OIDs) and return relevant network information. The IP network browser can perform regular scans across the network and deliver results in customizable charts and graphs. Or, you can drill down within the MIB browser to discover OID metrics for individual nodes.
NPM offers several powerful network tools that provide insight into network performance and end-user experience. Among other features, NPM offers the PerfStack™ performance analysis dashboard, robust alerting features, network discovery and mapping tools (including wireless heatmapping), and visual hop-by-hop path analysis.
Comprehensive fault monitoring and performance management for your network.
Get to the root cause quicker with intelligent, dependency and topology-aware network alerts.
Hop-by-hop analysis of cloud or on-prem applications or services.