- Events
-
Partners
- Government
- Customer Portal
- Contact Us
- Contact Sales
-
English
Before you can begin network fault management, you need to make sure your monitoring and management software has a record of the devices on your network. Periodic network discovery is key to continuous network availability. SolarWinds® Network Performance Monitor (NPM) is designed to discover SNMP and WMI-enabled devices and can make fault management easier for network administrators.
You can use NPM’s Network Sonar Wizard to scan your network for devices like routers, switches, and servers, enter new SNMP credentials, or choose existing credentials used on your network, including credentials for Windows servers or VMware devices, if you want to monitor them. SolarWinds uses WMI credentials to collect CPU, memory, and volume data from Windows servers that don’t support SNMP.
Faulty network devices can pose a real threat to continuous network availability, which can lead to decreased performance and unhappy end users. Some of the most likely causes of network faults include hardware issues, high CPU/memory utilization, high errors and discards, and QoS issues. However, finding these faulty devices—and the root causes of their issues—can often be challenging. Instead of manually performing network fault monitoring tasks, IT teams can invest in network fault management tools to locate devices with suspicious activity more easily.
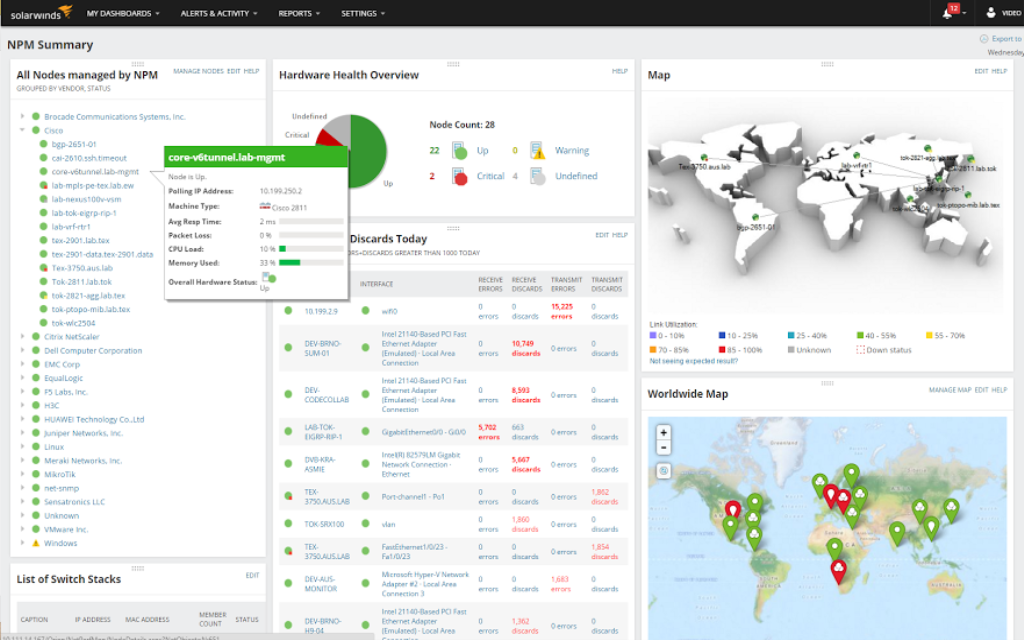
Using SolarWinds NPM, you can quickly view the current node count with statuses classified as Up, Warning, Critical, and Undefined. You can also find devices in critical status by drilling down to find the list of down nodes. NPM makes it easier to access monitored data about each node, so you can gather more details and identify the root cause of the issue.
You never want to hear about a network issue for the first time when an end user—whether it’s a customer or an employee—reports it to you. The best way to stay a step ahead is through constant network fault monitoring to track key metrics and can alert you when there’s an issue on monitored nodes.
NPM comes with network diagnostics tools to help track performance and pinpoint the source of network faults. NPM’s network fault management tools are built to use ICMP and SNMP to retrieve real-time network diagnostic data from monitored devices in your environment and can alert you to poor network conditions like slow traffic, loss of packets, or impaired devices. NPM is also designed to provide accurate network fault management in an intuitive and customizable interface, making it easier to identify and troubleshoot problems.
When it comes to network fault management, consistently monitoring your system for performance issues can make it easier to detect faults and resolve related network problems in a timely manner.
SolarWinds NPM is comprehensive network fault monitoring software designed to help you ensure your network is running at peak performance levels. With NPM, you can see details about monitored nodes from a clear, intuitive interface where you can easily drill down on a node or server status indicator to see detailed fault and performance statistics. With out-of-the-box support for many vendors and operating systems, NPM’s network usage monitor can also ensure you can easily collect, view, and identify conditions that could potentially cause a network outage or performance degradation with the ability to create custom alerts and generate automated reports.
Network faults are the result of any event or malfunction that interferes with, degrades, or obstructs service delivery. Faults can come in several different forms. Some of the most common types of faults include hardware failures, port status changes, or connectivity losses.
Some specific examples of common network faults are:
Network fault monitoring can pose a real threat to continuous network availability. Faulty network devices can seriously interfere with network performance for your end users. Network fault monitoring is important because it can help you locate faulty devices and performance issues before they have a larger impact on network availability.
Network fault monitoring can also help you stay ahead of your end users when it comes to identifying network faults. By continuously monitoring your network devices for potential issues, you can identify problematic devices and resolve issues before anyone realizes there’s an issue.
Network fault management works by identifying, isolating, and resolving issues that can impact network availability, such as operating errors, program and configuration errors, and human errors. Network fault monitoring involves keeping track of key nodes and metrics, so you’re equipped to detect the smallest deviation from normal performance and address it before it grows into a serious problem.
Network fault monitoring software can continuously monitor your network, including hardware performance that can lead to network faults, for possible issues. By having performance baselines in place, a network fault monitoring tool can help quickly detect even the smallest deviation from normal performance. When deviation occurs, the tool can automatically send an alert to the proper stakeholders, so troubleshooting can begin as soon as possible.
The next step of network fault management is performing event correlation and aggregation, which can be critical for successful root cause analysis. The best tools can also help isolate the metric most likely to play an important role in helping restore service, so you can get the details you need with just a few clicks, trace faults more accurately, and quickly address the causes of network fault.
SolarWinds Network Performance Monitor (NPM) can help ensure you’re the first to know about network fault issues. With NPM, you can:
When it comes to network fault monitoring, NPM makes it easier to stay on top of your entire network. Not only can the tool automatically discover the devices on your network, it can also automatically poll each device for data to provide current insights into performance.
NPM also lets you set customizable alerts with your own error thresholds, so you’re alerted as soon as a node or metric crosses it. When an issue occurs, the NPM dashboard makes it easier to view at-a-glance which nodes are involved as the affected widgets will either appear as red (critical) or yellow (warning).
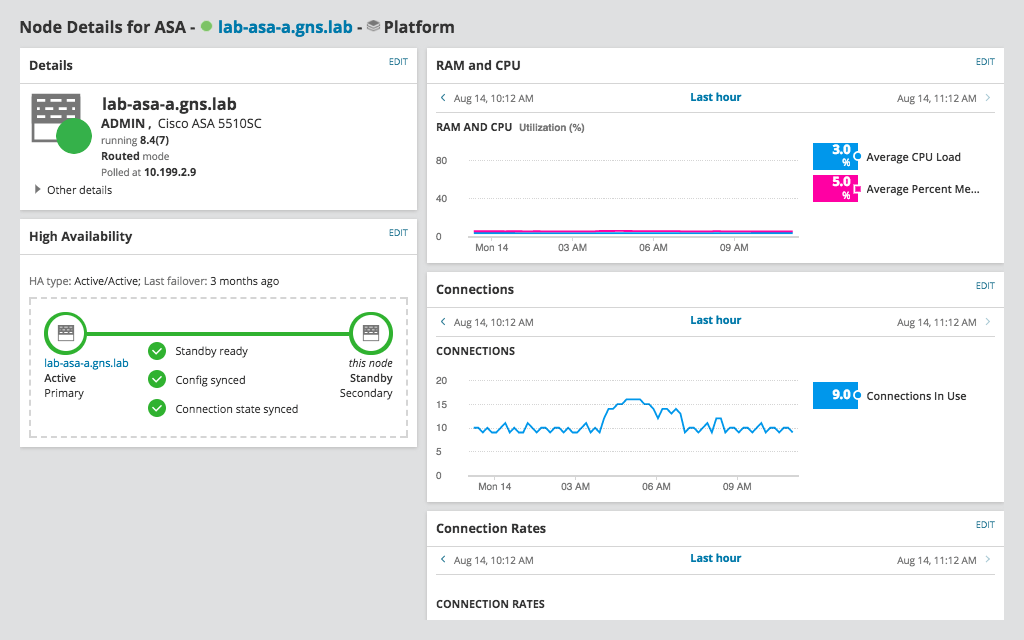
Once you identify the problematic node, you can begin trying to resolve the issues. NPM gives you the information you need at-a-glance to troubleshoot network fault issues more effectively, including statistics on response time, packet loss, CPU load, and memory utilization.
Network faults are the result of any event or malfunction that interferes with, degrades, or obstructs service delivery. Faults can come in several different forms. Some of the most common types of faults include hardware failures, port status changes, or connectivity losses.
Some specific examples of common network faults are:
Network fault monitoring can pose a real threat to continuous network availability. Faulty network devices can seriously interfere with network performance for your end users. Network fault monitoring is important because it can help you locate faulty devices and performance issues before they have a larger impact on network availability.
Network fault monitoring can also help you stay ahead of your end users when it comes to identifying network faults. By continuously monitoring your network devices for potential issues, you can identify problematic devices and resolve issues before anyone realizes there’s an issue.
Network fault management works by identifying, isolating, and resolving issues that can impact network availability, such as operating errors, program and configuration errors, and human errors. Network fault monitoring involves keeping track of key nodes and metrics, so you’re equipped to detect the smallest deviation from normal performance and address it before it grows into a serious problem.
Network fault monitoring software can continuously monitor your network, including hardware performance that can lead to network faults, for possible issues. By having performance baselines in place, a network fault monitoring tool can help quickly detect even the smallest deviation from normal performance. When deviation occurs, the tool can automatically send an alert to the proper stakeholders, so troubleshooting can begin as soon as possible.
The next step of network fault management is performing event correlation and aggregation, which can be critical for successful root cause analysis. The best tools can also help isolate the metric most likely to play an important role in helping restore service, so you can get the details you need with just a few clicks, trace faults more accurately, and quickly address the causes of network fault.
SolarWinds Network Performance Monitor (NPM) can help ensure you’re the first to know about network fault issues. With NPM, you can:
When it comes to network fault monitoring, NPM makes it easier to stay on top of your entire network. Not only can the tool automatically discover the devices on your network, it can also automatically poll each device for data to provide current insights into performance.
NPM also lets you set customizable alerts with your own error thresholds, so you’re alerted as soon as a node or metric crosses it. When an issue occurs, the NPM dashboard makes it easier to view at-a-glance which nodes are involved as the affected widgets will either appear as red (critical) or yellow (warning).
Once you identify the problematic node, you can begin trying to resolve the issues. NPM gives you the information you need at-a-glance to troubleshoot network fault issues more effectively, including statistics on response time, packet loss, CPU load, and memory utilization.
Network Performance Monitor
Monitor network faults and performance with a comprehensive network fault management system
Get to the root cause quicker with intelligent, dependency, and topology-aware network alerts
Automatically discover new devices for more complete network fault monitoring