- Events
-
Partners
- Government
- Customer Portal
- Contact Us
- Contact Sales
-
English
Understand network performance in a new way with a map of packet paths between users and services.
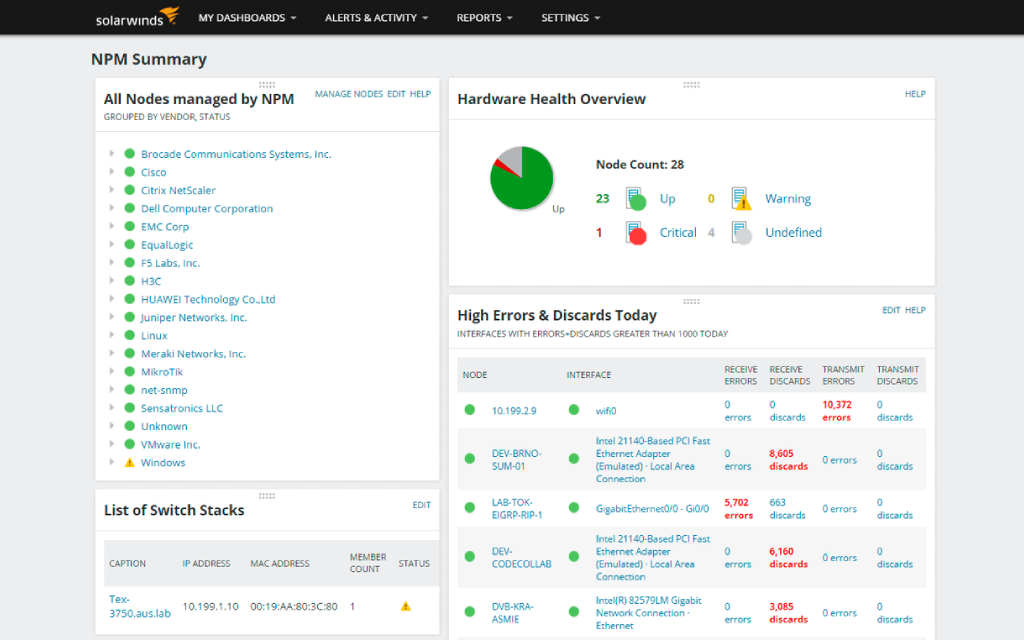
Gain a visual map of on-premises, cloud, or hybrid networks, including nodes beyond your control.
Ensure users stay connected to the services they need by addressing both current and past slowdowns.
Set probes, probing intervals, and a path between user and service—all in just a few minutes.
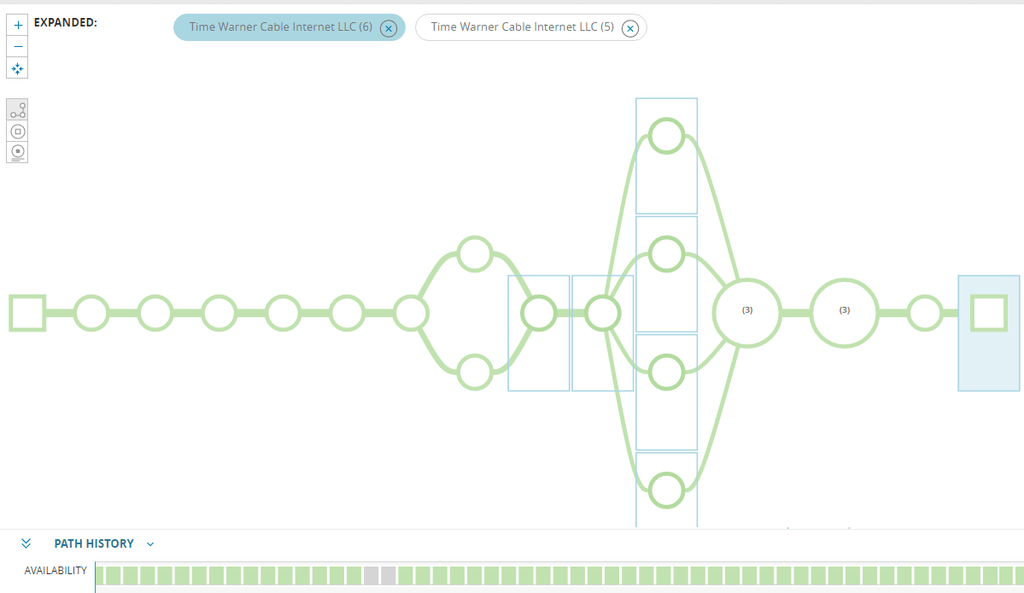
Visual traceroute is the process of mapping the hop-by-hop paths that IP packets travel to reach a specific destination. This process results in a visual display of the relevant pathway and the precise locations of any packet slowdowns.
Visual traceroute works by examining packet transmission time for each hop between a source computer and a destination device. Traceroute probes each segment of the path, calculating real and typical packet times in order to identify where a slowdown is currently occurring or has occurred in the past.
Visual traceroute is important because it allows network administrators to quickly diagnose slowdowns within a network and ensure optimal end-user experience. A traceroute provides a visual way to pinpoint where delays in responses and routing loops are occurring, allowing admins to troubleshoot the correct network device or service.
A visual traceroute tool helps automate the process of discovering and mapping IP paths. Traceroute software can offer an easy-to-use, color-coded visual display rather than a textual output. Some tools may provide additional functionalities, like extending the traceroute to analyze path segments beyond the internal network. Use a visual traceroute tool to easily view packet paths, including services outside your network.
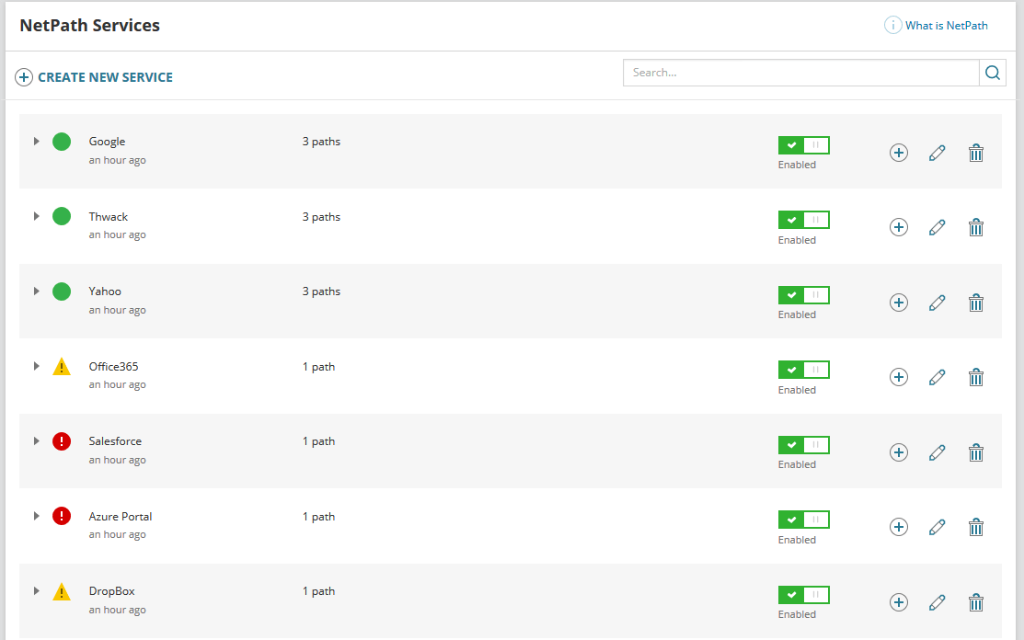
NetPath is the visual traceroute feature in Network Performance Monitor designed to provide a straightforward way to create a visual traceroute service. NetPath allows you to view internet paths outside internal infrastructure, tracing them into the cloud and other services. NetPath provides a hop-by-hop explanation of packet paths and slowdowns, enabling more comprehensive oversight.
NetPath allows users to set probes and configure custom probing intervals that suit their requirements. The tool then automatically provides a visual map of pathways between user and service, along with relevant performance data for both current and historical contexts, color-coding issues to provide instant visibility.
Visual traceroute is the process of mapping the hop-by-hop paths that IP packets travel to reach a specific destination. This process results in a visual display of the relevant pathway and the precise locations of any packet slowdowns.
Visual traceroute works by examining packet transmission time for each hop between a source computer and a destination device. Traceroute probes each segment of the path, calculating real and typical packet times in order to identify where a slowdown is currently occurring or has occurred in the past.
Visual traceroute is important because it allows network administrators to quickly diagnose slowdowns within a network and ensure optimal end-user experience. A traceroute provides a visual way to pinpoint where delays in responses and routing loops are occurring, allowing admins to troubleshoot the correct network device or service.
Network Performance Monitor
Quickly create a hop-by-hop packet path map and visualize network infrastructure.
Gain insights into slowdowns outside your business network.
Improve end-user connectivity to critical services.