- Events
-
Partners
- Government
- Customer Portal
- Contact Us
- Contact Sales
-
English
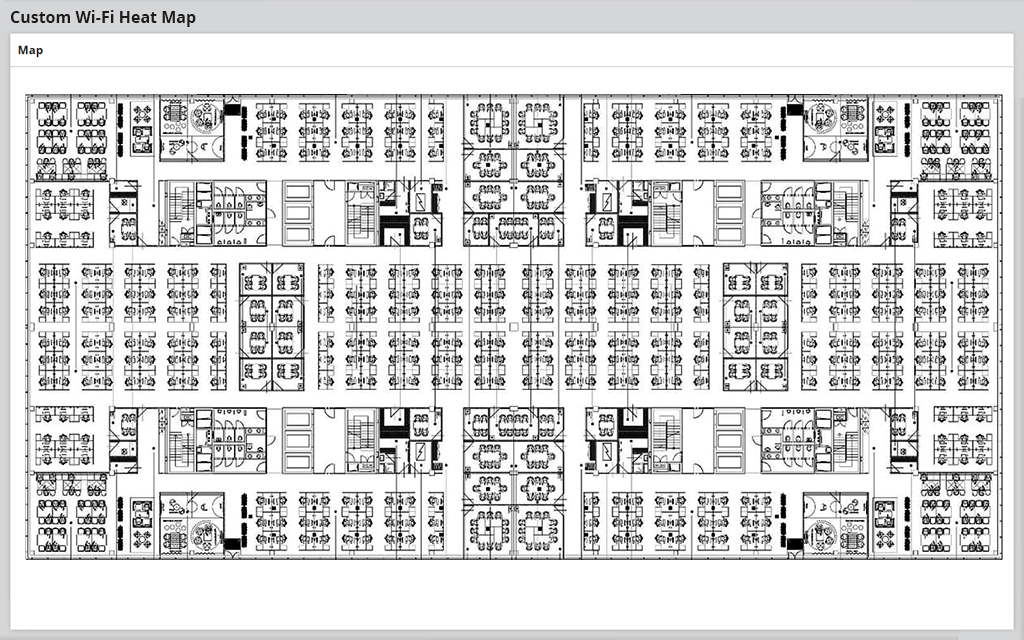
Wi-Fi heat mapper creates color-coded maps for insight into access points (APs) and client coverage.
Wi-Fi heat maps can be easy to create if you’re using Network Performance Monitor (NPM) 11.5 or later.
Easily troubleshoot wireless dead zones by leveraging accurate signal strength information.
Find lost or rogue devices by pinpointing all connected client locations within three meters.
A Wi-Fi heat map, also called a Wi-Fi coverage map, shows the real-time coverage and quality of a wireless infrastructure overlaid on a map, typically a floor plan.
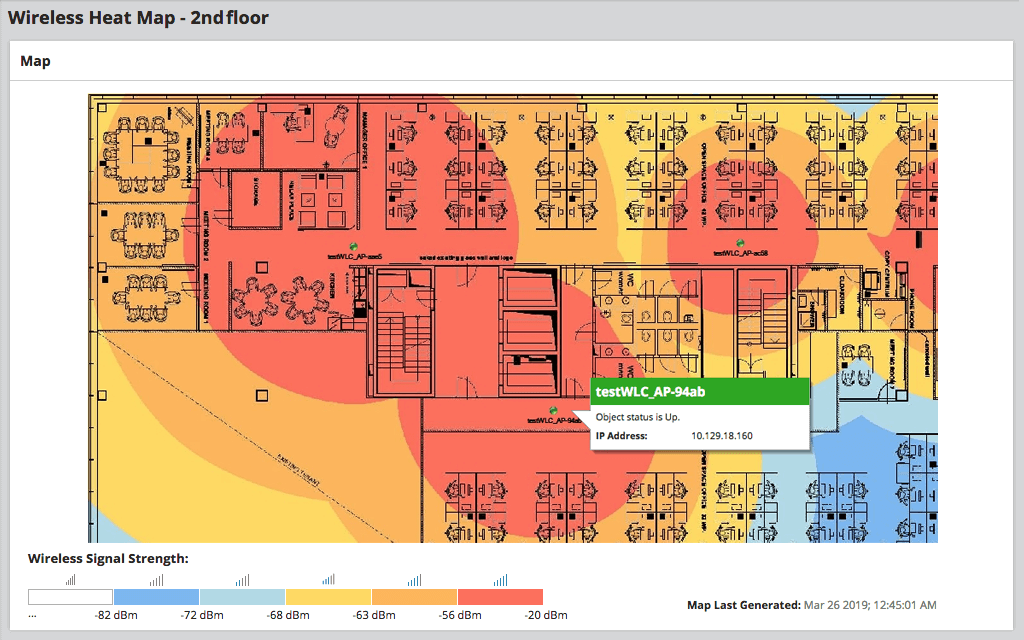
Wireless heat maps use an algorithm to determine signal coverage, which is then displayed using color coding. This heat coloring is based on estimated signal coverage combined with the results of each AP seeing the signal of nearby APs. In NPM, wireless heat maps are designed to show where the Wi-Fi signal is best using a dark red color. As signal strength drops, cooler colors represent weaker wireless signal strengths.
Creating a Wi-Fi heat map allows network administrators to visualize the real signal strengths of their wireless infrastructure, and more quickly understand which clients have limited or missing Wi-Fi connections.
With the rise of BYOD culture and increasing workplace mobility, all businesses need insight into Wi-Fi coverage to ensure productivity. Enterprises with larger facilities in particular need to ensure widespread connectivity. Using a Wi-Fi heat mapper can help ensure optimal coverage, locate dead zones, and identify areas of excess coverage.
A Wi-Fi heat map, also called a Wi-Fi coverage map, shows the real-time coverage and quality of a wireless infrastructure overlaid on a map, typically a floor plan.
Wireless heat maps use an algorithm to determine signal coverage, which is then displayed using color coding. This heat coloring is based on estimated signal coverage combined with the results of each AP seeing the signal of nearby APs. In NPM, wireless heat maps are designed to show where the Wi-Fi signal is best using a dark red color. As signal strength drops, cooler colors represent weaker wireless signal strengths.
Creating a Wi-Fi heat map allows network administrators to visualize the real signal strengths of their wireless infrastructure, and more quickly understand which clients have limited or missing Wi-Fi connections.
Network Performance Monitor
Avoid downtime and dead zones with full Wi-Fi mapping visibility.
Instantly refer to saved, updated heat maps of the facility.
Quickly pinpoint the location of connected clients and rogue devices.