- Events
-
Partners
- Government
- Customer Portal
- Contact Us
- Contact Sales
-
English
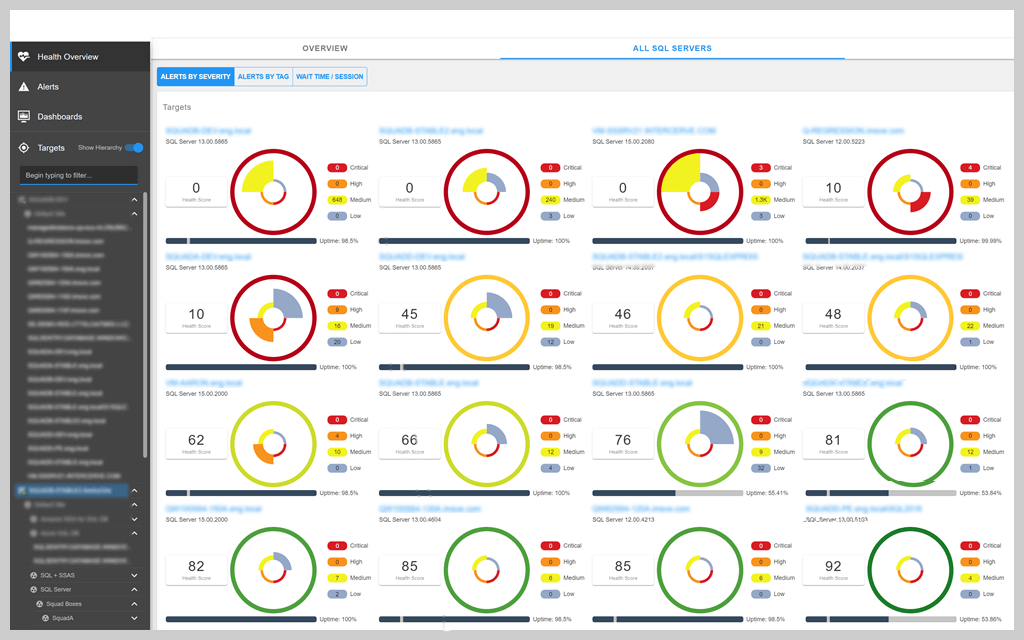
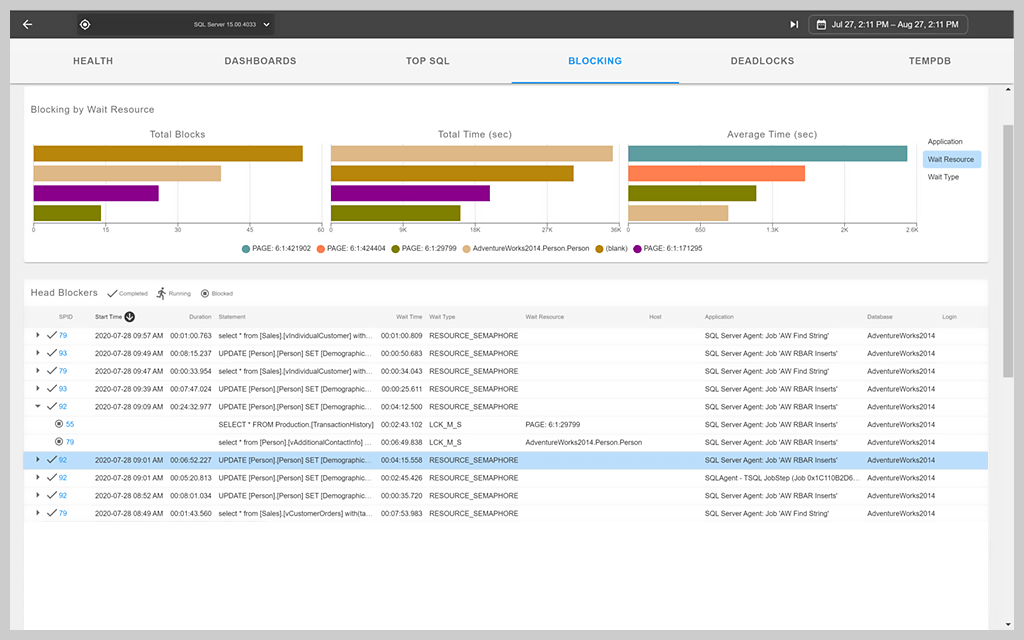
SQL Server wait stats are an effective way to detect bottlenecks in your SQL Server, and troubleshoot the root cause of performance issues. Many wait types are an important clue in SQL Server performance troubleshooting. With SolarWinds® SQL Sentry®, you can view current and historical wait stats from a centralized dashboard for a bird’s-eye view of your SQL Server client statistics.
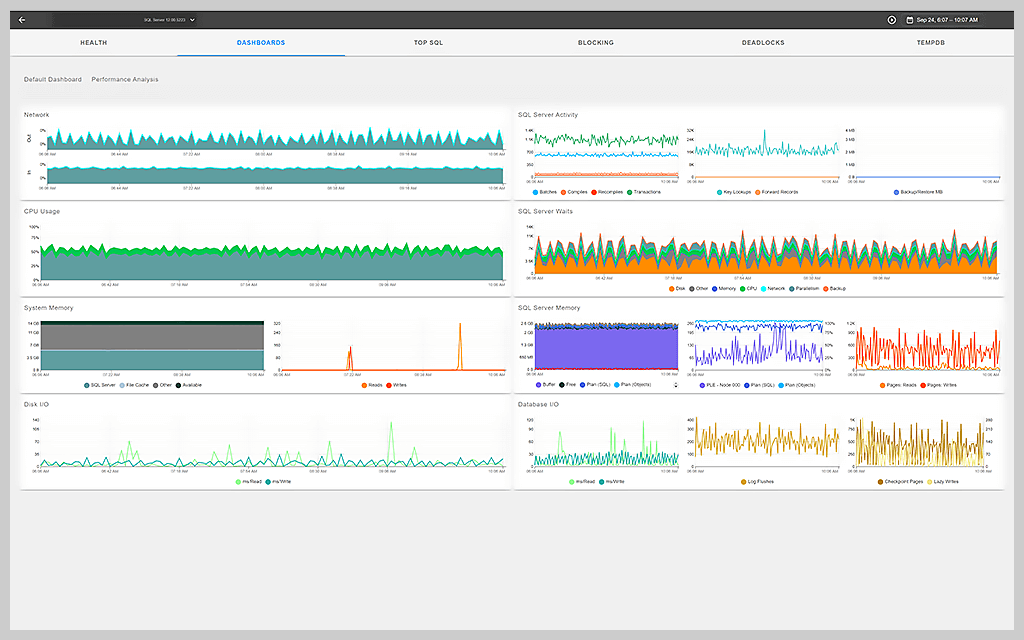
For efficient SQL Server analysis, SQL Server management software should streamline analysis with a user-friendly interface. The SQL Sentry dashboard includes many SQL Server performance metrics, including wait stats, for a thorough approach to SQL Server troubleshooting.
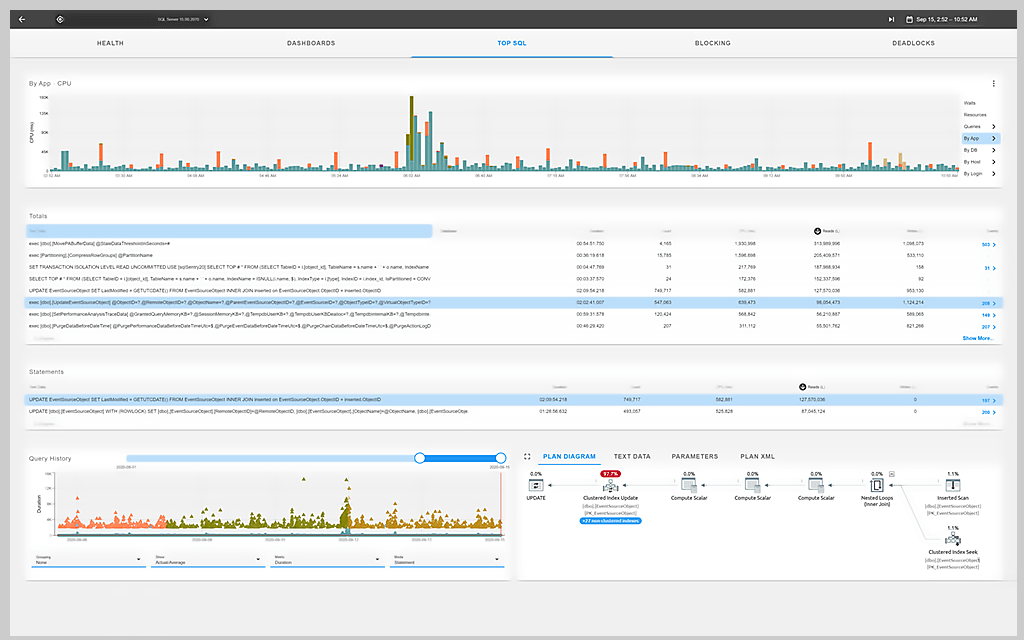
With SQL Server analysis, time is always of the essence. This is why SQL Sentry provides intuitive visualizations of wait statistics in SQL Server for both historical and current SQL Server wait instances. You can view summarized statistics data for a detailed understanding of trends and pinpoint the time frame where your most problematic statistics lie. And to fully understand SQL Server wait stats, visualizations allow you to see trends and inform troubleshooting by identifying which wait types are consistently slow.
Reporting is an important component of SQL Server wait stats analysis. When you generate a report, you can understand the broader trends possibly causing long wait times. Preset report formats allow you to generate sophisticated reports for custom time frames without manually configuring each SQL Server report. Reporting is an effective way to summarize trends, identify overarching issues, and document your SQL Server wait statistics analysis for future reference.
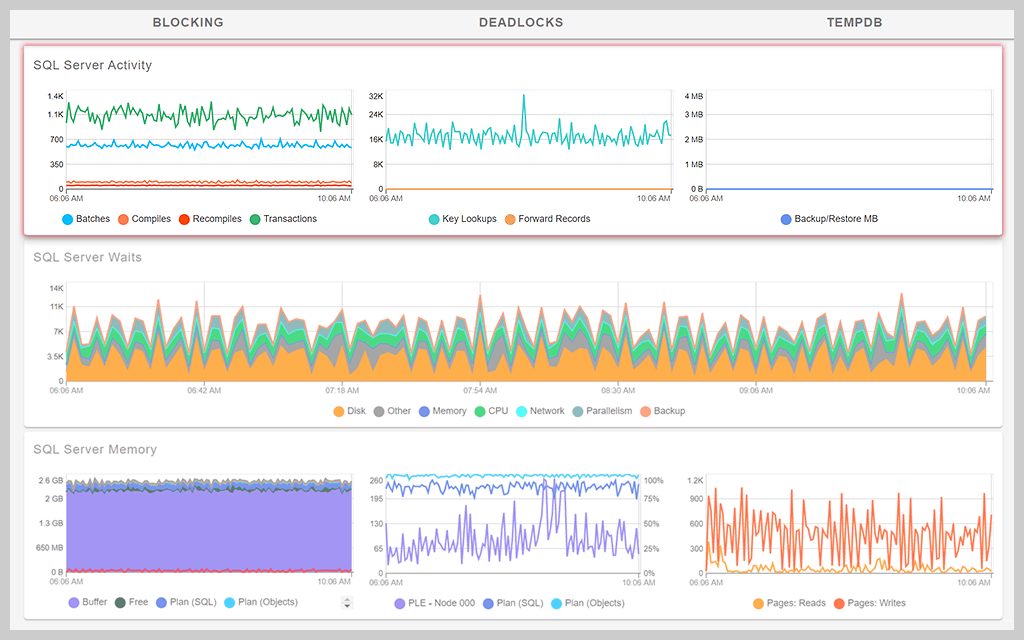
There are plenty of wait types not easily understood with a traditional SQL Server wait stats monitor. These wait types provide unique challenges to monitoring since they tend to exhibit incorrectly long or short wait times. With SQL Sentry, you can monitor and troubleshoot complex wait types like SQL Server CXPACKET while accounting for parallelism. SQL Sentry addresses other commonly misinterpreted wait types, including LCK_M_XX waits, OLEDB waits, PAGEIOLACH_SH waits, and more.
Get More on SQL Server Wait Stats
Do you find yourself asking…
SQL Server wait stats are an integral component of your SQL Server management. The job of wait statistics is to show your server’s threads and their status in the scheduler and how many threads at a given time are waiting in the waiter list. With a complete understanding of your thread inventory, you can identify trends in wait times and detect sources of common issues with resource deficiency. In short, SQL Server wait stats show you different measurements of your SQL Server performance—which threads are waiting, how long they’re waiting, and what wait type is associated with each thread.
SQL Server management tools can associate specific threads with their wait types. Once you identify wait stats and wait type, you can pinpoint the root cause of downtime with maximum precision.
For IT admins, wait statistics in SQL Server management offer an effective way to identify the root cause of downtime for troubleshooting. As any admin knows, application downtime is a costly inefficiency for your client’s enterprise. By using current and historical wait stats in SQL Server, you can troubleshoot bottlenecks and minimize downtime, saving you time, money, and hassle.
To analyze wait stats, SQL Server management requires more than only an understanding of your current SQL Server waits. Even though autonomous resources offer insight into your SQL Server wait resources, effective troubleshooting means you understand overall trends—not merely current wait types and wait times.
There are plenty of wait types SQL Server tools consistently get wrong, like CXPACKET wait types. Due to the incomplete nature of traditional SQL Server monitoring tools, sophisticated SQL Server wait stats analysis requires a more comprehensive understanding of SQL Server client statistics.
The optimal approach to SQL Server performance troubleshooting is a tried-and-true methodology utilizing wait statistics, performance monitor queues, and other relevant performance metrics.
SolarWinds SQL Sentry provides a tool for identifying wait stats resource consumption, combined with historical trends. Intuitive data visualization and custom intervals help you streamline your analytics and gain a bird’s-eye view into SQL Server wait time trends.
Wait types help you determine a more specific bottleneck on a SQL Server—such as schema locking issues, plan cache memory pressures, or backup I/O problems—instead of simply generic locking, memory, or I/O issues you might identify through other methods. The promise of wait stat analysis is—you now have an excellent way to quickly determine where the strongest pressures are building up on specific resources within SQL Server.
When your application uses resources from the SQL Server relational database, SQL Server executes requests using threads. A thread executes code to communicate with the SQL Server on a tight schedule. If these threads are unable to execute their required commands due to a lack of server resources, they must wait to complete the query until they have enough resources to continue.
Within your SQL Server, a tool called a scheduler serves as the mechanism for moving individual threads through the SQL Server to retrieve data and complete a query. The scheduler serves several important purposes within your SQL Server, with each thread’s major life cycle occurring within your schedule. The scheduler contains the SQL Server processor, which contains threads before and during their execution of the desired code.
Before a thread executes code, the scheduler houses all the threads waiting to execute their respective codes. This runnable queue isn’t an inherent source of downtime since the threads typically move through the queue at the correct speed determined by the scheduler.
There are plenty of cases in which threads are unable to move through the runnable query on time due to a lack of resources. When a thread can’t execute code as scheduled because of insufficient resource availability, it gets stuck on the waiter list.
The scheduler typically contains a constant backup of threads on the waiter list unable to move forward for various reasons. For optimal wait statistics, SQL Server management tools can help identify the causative relationship between threads in your waiter list, and the resource deficiencies causing the bottleneck.
Each resource deficiency potentially causing a wait time is called a wait type. In short, a wait type is the reason why your thread is unable to move forward through the scheduler and properly execute its code.
There are hundreds of wait types, each of which provides unique insight into the causes of bottlenecks. Some common wait types include:
In a wait type-based SQL Server wait stats tool, like SQL Sentry, your wait type library provides a complete record of wait types for fast and easy identification. Once your SQL Server analytics tool has identified the wait type of a thread, you can understand which resources are limited, and you can troubleshoot the bottleneck.
With a user-friendly format, SolarWinds SQL Sentry provides a highly intuitive way to visualize SQL wait time stats without combing through mountains of code to get there. Simply log onto your SQL Sentry dashboard, view wait stats for specific threads or wait types, and identify where you need to troubleshoot issues.
Other key features of SQL Sentry include:
On top of high-precision SQL Server wait time analytics, SQL Sentry also provides customizable graphs, charts, and displays for a more effective solution to SQL Server analysis. With custom features, high-precision server analytics, and an intuitive UI, SolarWinds SQL Sentry helps you identify SQL Server wait times for minimum downtime and maximum resource capacity.
SolarWinds SQL Sentry
Visualize SQL Server wait stats intuitively with SQL Server reports for any customized timeframe
Gain insights into wait types to quickly identify and resolve problems
Identify bottlenecks from your centralized dashboard with SQL Server wait stats monitoring