- Events
-
Partners
- Government
- Customer Portal
- Contact Us
- Contact Sales
-
English
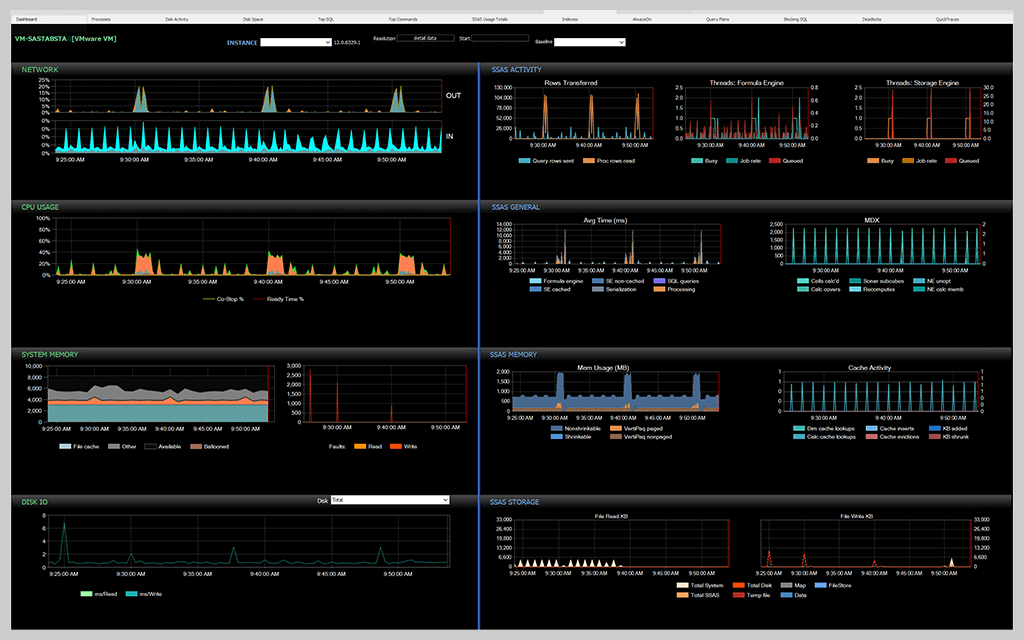
SQL Sentry adjusts the performance metrics display in the Performance Analysis Dashboard based on whether you're monitoring a Tabular or a Multidimensional SSAS instance.
The SSAS Activity section displays information to help you correlate the rate of rows sent by the server to the clients with the number of threads used by the SSAS Formula and Storage Engines.
The SSAS General section displays information about the activity taking place on your monitored server instance, including average time, which shows what the SSAS instance is spending most of its time doing. The General section also displays activity such as the number of MDX cell calculations, which can help you pinpoint issues with either the SSAS Formula or Storage Engine.
The SSAS Memory section gives you details about how the server instance is using the memory allocated to it. When monitoring a Tabular instance, you can see the memory counters and the VertiPaq memory limit. This data helps you understand where physical memory usage might cause performance issues.
The SSAS Storage section provides information to help you determine whether the disk system is a bottleneck for your SSAS instance.
You’ll need accurate information, and you’ll need to consider the following:
The cause of SSAS performance problems could be lurking in any number of places. To successfully troubleshoot SSAS performance, you need a baseline. You also need the right monitoring tool—one that can give you deep insights into the performance metrics that help you analyze your SSAS environment in real time and during a specified period in the past.
SQL Sentry gives you the detailed metrics you need to monitor, diagnose, and optimize the performance of your SSAS environment.
SolarWinds SQL Sentry
Fast root cause analysis
Visibility across the data estate
Deep, actionable performance metrics with easy deep-dive capabilities