- Events
-
Partners
- Government
- Customer Portal
- Contact Us
- Contact Sales
-
English
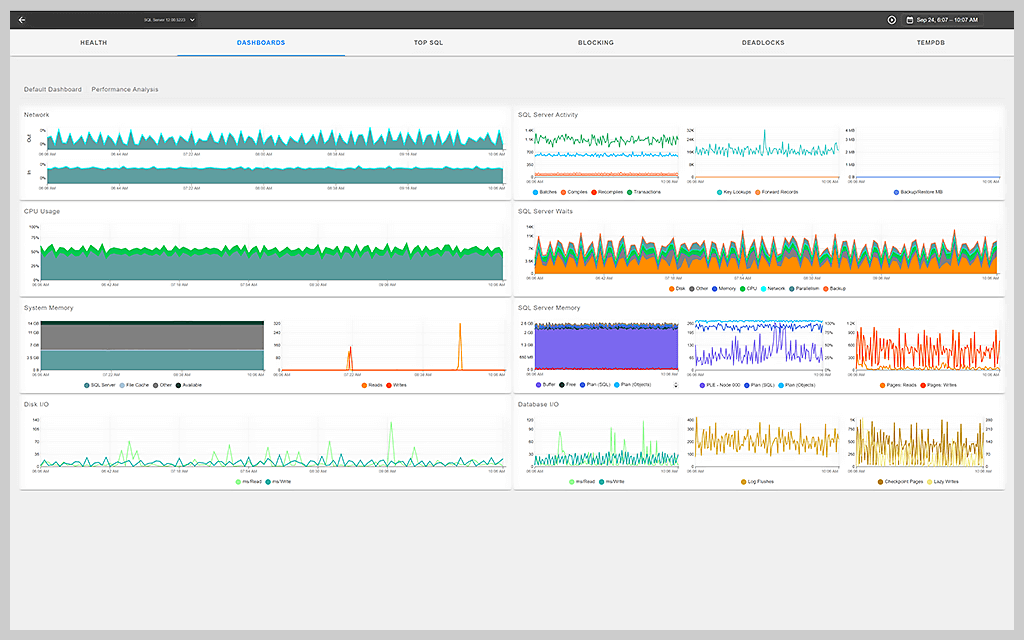
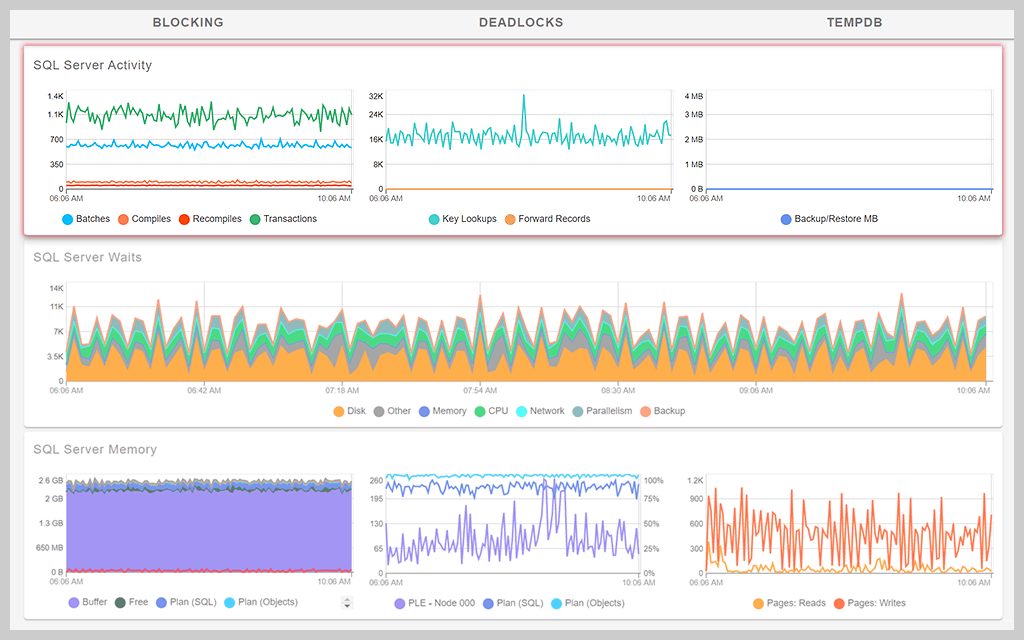
With the SQL Sentry® Performance Analysis Dashboard, you can display important database performance metrics used in determining the load and health of a monitored SQL Server instance.
The dashboard shows you both your Windows (or virtual host) metrics and the metrics related to the monitored database server.
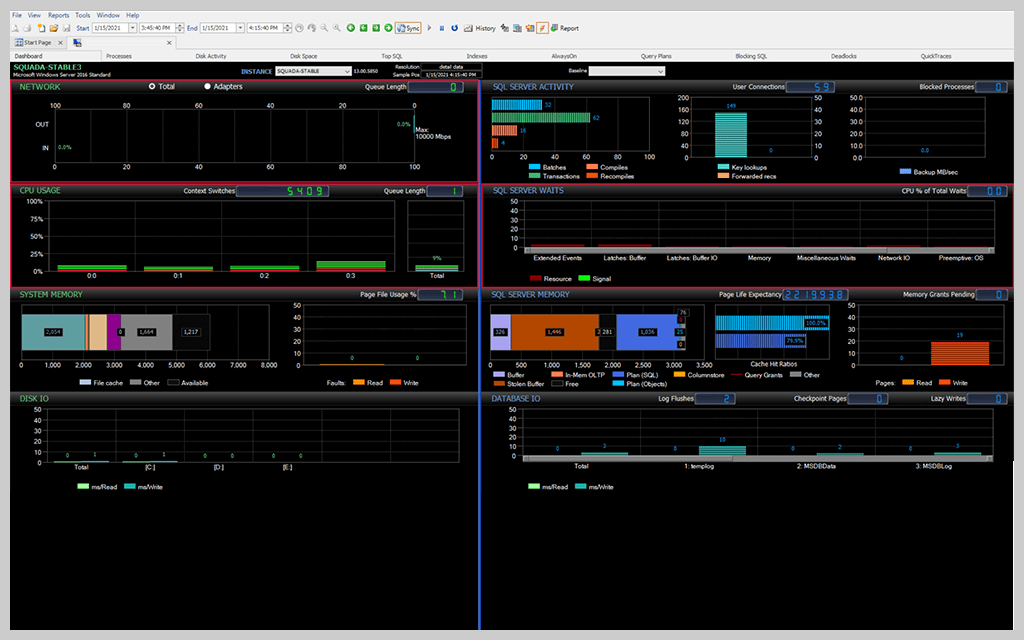
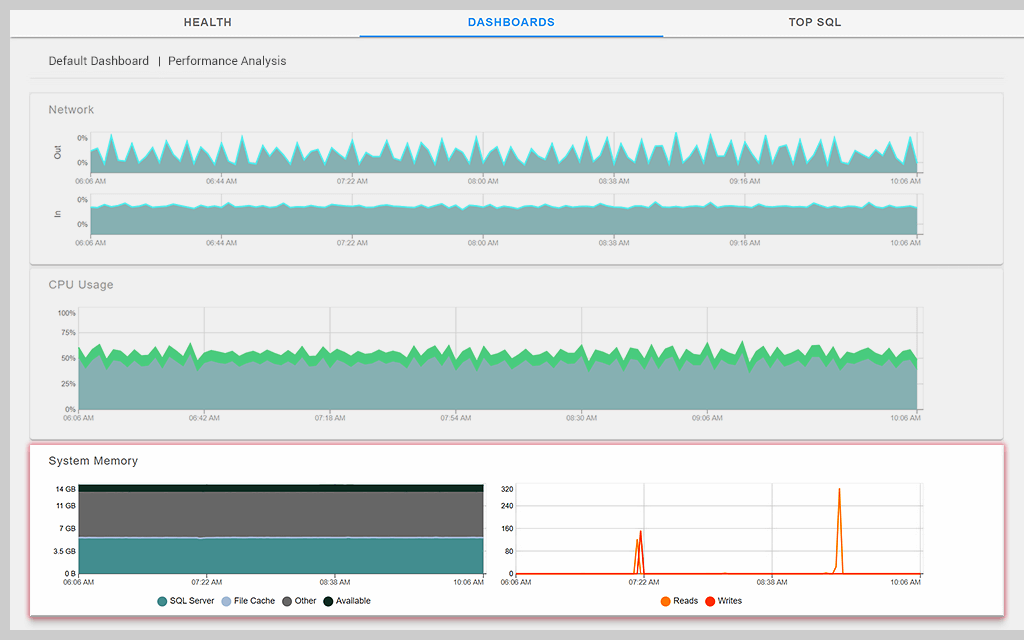
The dashboard is split into different sections, including the Network section, which displays the network traffic and utilization of information related to a monitored server. The CPU usage section shows the total CPU usage of the server as well as details on context switching, user time, kernel time, and more.
You have two dashboard modes: Sample mode and History mode. In Sample mode, you can see activity for a specific time, and in History mode, you can display how Windows and the SQL Server instance have been performing over a selected time period.
In History mode, you can also overlay your display with a baseline showing your server's current performance data relative to the chosen benchmark baselines. In this view, you might even see warning indicators for various SQL Sentry Advisory Conditions.
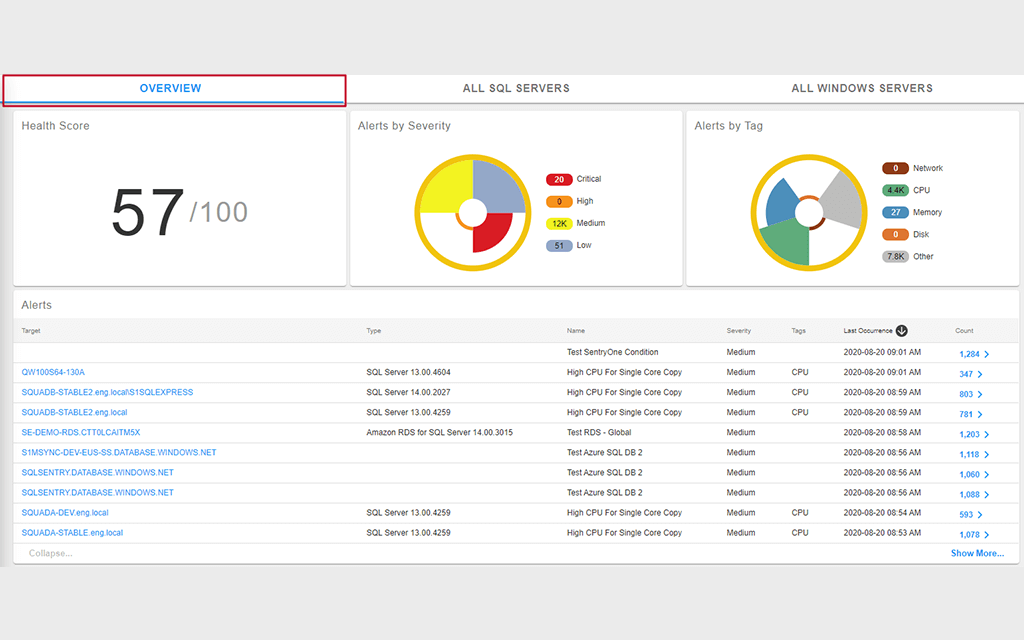
SQL Sentry® Performance Analysis Dashboard gives an overall snapshot of database environment health across the Microsoft data platform. You can easily drill down into details to uncover the root cause of performance problems.
SQL Sentry® Performance Analysis Dashboard gives an overall snapshot of database environment health across the Microsoft data platform. You can easily drill down into details to uncover the root cause of performance problems.
SolarWinds SQL Sentry
Fast root cause analysis
Visibility across the data estate
Deep, actionable performance metrics with easy deep-dive capabilities