- Events
-
Partners
- Government
- Customer Portal
- Contact Us
- Contact Sales
-
English
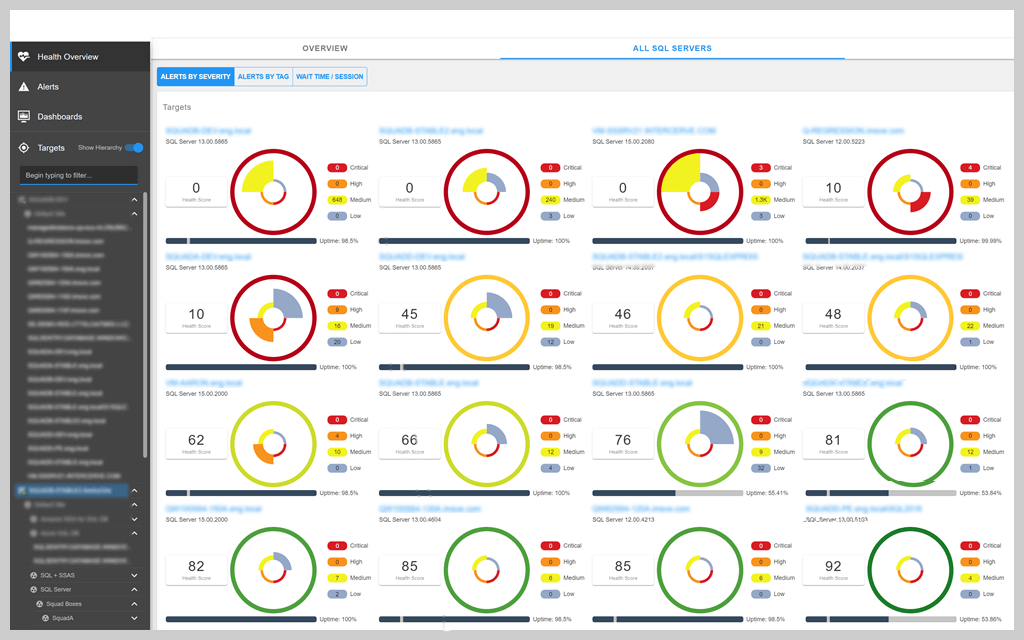
With SQL Sentry® Portal, you can view detailed, actionable information on the performance of your monitored SQL Server, Azure SQL Database, and Windows targets from your web browser.
SQL Sentry Portal connects to your SQL Sentry database and displays important performance information in an easy-to-use web interface.
View important performance metrics for your monitored targets, including the following:
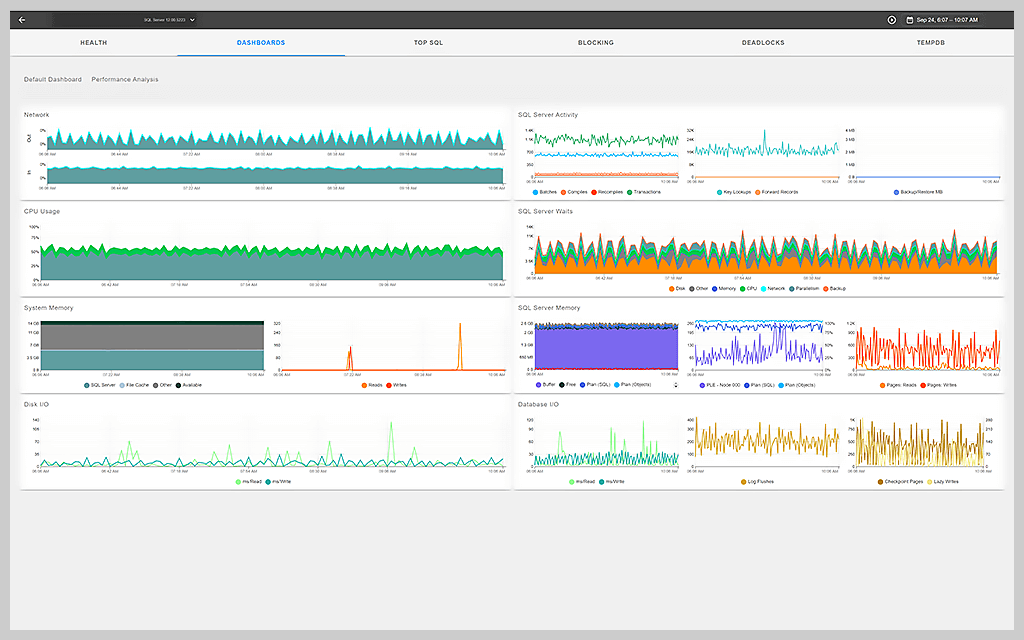
You can see real-time data or data for a specific time period using the default Dashboard view or by creating custom charts and dashboards to display the most important metrics.
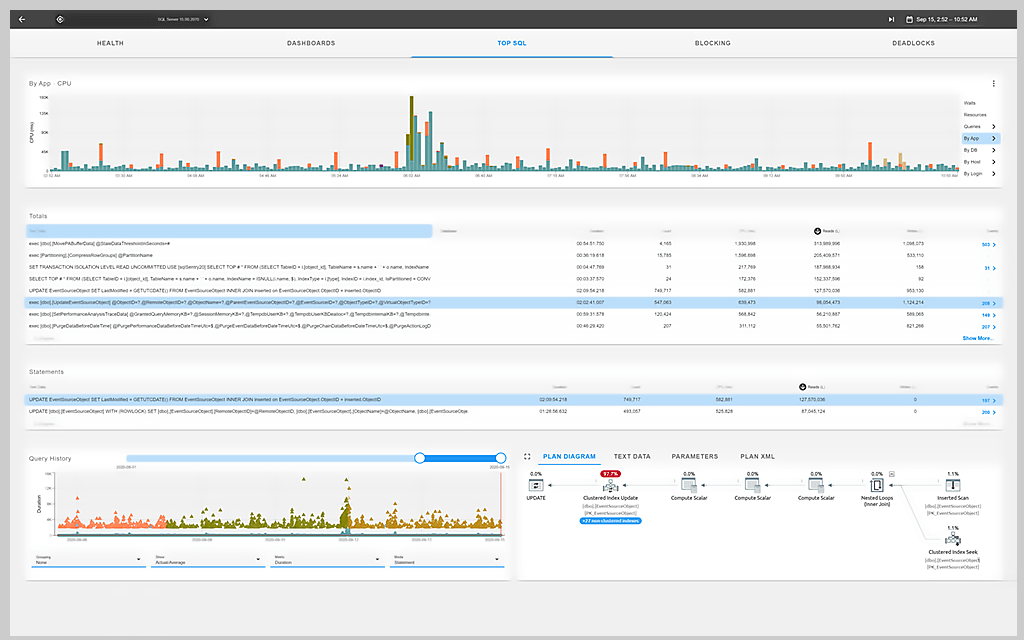
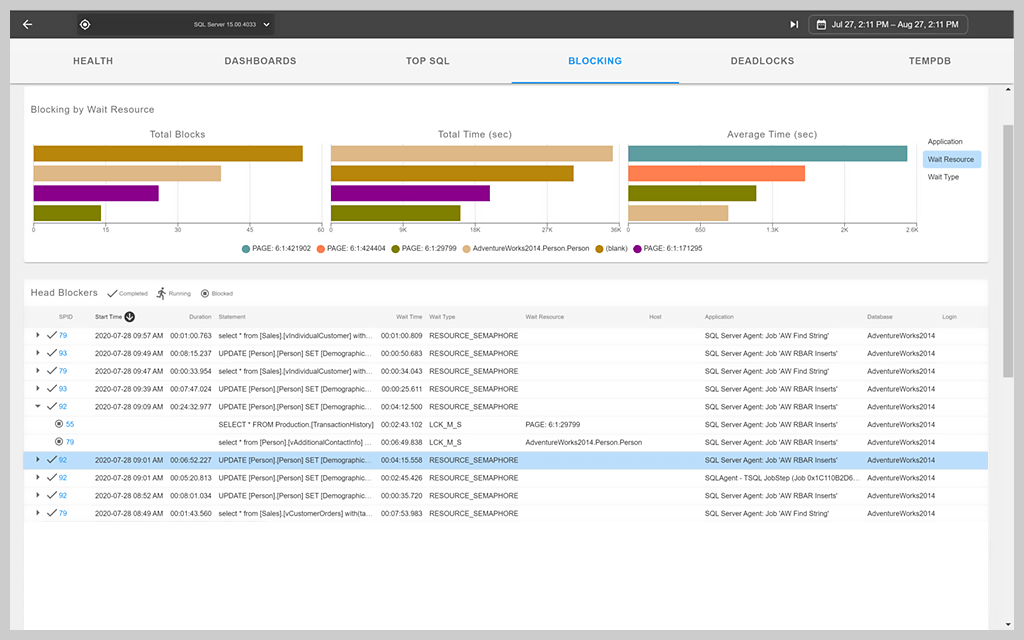
Quickly identify the root cause of SQL Server blocking in the Blocking view. With an intuitive graphical representation of a blocking chain, you can easily analyze blocking details and view the relationships between blocking and blocked sessions.
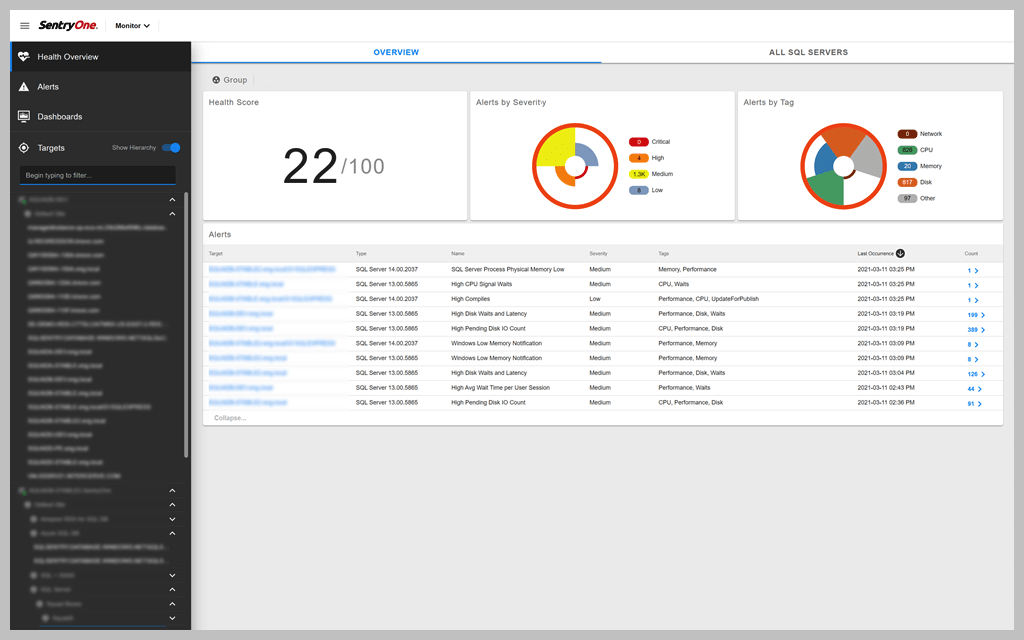
SQL Sentry® Portal is a web interface designed to show you real-time and historical performance data for your monitored SQL Server, Azure SQL Database, and Windows targets in your web browser.

Efficiently troubleshoot deadlocks that have occurred on your monitored targets in the Deadlocks view. The simple, intuitive deadlocks diagram makes it easy to analyze the events leading to the SQL Server deadlock.
SQL Sentry Portal connects to your existing SQL Sentry database, which remains in the location you designated when you configured your setup.

With the TempDB view, you get enhanced visibility into the health and performance of tempdb. Easily analyze file space usage across your tempdb data files and tempdb objects, activity, and session usage for SQL Server and Azure SQL Database.
SQL Sentry Portal currently supports SQL Server, Azure SQL Database, Windows targets, and VMware targets.
SQL Sentry Portal is installed as a self-hosted HTTP Windows service and can be reverse proxied through IIS (optional). The SQL Sentry Portal comes packaged with the SQL Sentry installer. Download the latest build of SQL Sentry here. Then, follow the SQL Sentry Portal installation instructions.
Once your SQL Sentry installation has been configured and you’ve installed SQL Sentry Portal, you can use Google Chrome or Microsoft Edge to access the SQL Sentry Portal. See SQL Sentry Portal installation instructions for more details.
SQL Sentry® Portal is a web interface designed to show you real-time and historical performance data for your monitored SQL Server, Azure SQL Database, and Windows targets in your web browser.
Efficiently troubleshoot deadlocks that have occurred on your monitored targets in the Deadlocks view. The simple, intuitive deadlocks diagram makes it easy to analyze the events leading to the SQL Server deadlock.
SQL Sentry Portal connects to your existing SQL Sentry database, which remains in the location you designated when you configured your setup.
With the TempDB view, you get enhanced visibility into the health and performance of tempdb. Easily analyze file space usage across your tempdb data files and tempdb objects, activity, and session usage for SQL Server and Azure SQL Database.
SQL Sentry Portal currently supports SQL Server, Azure SQL Database, Windows targets, and VMware targets.
SQL Sentry Portal is installed as a self-hosted HTTP Windows service and can be reverse proxied through IIS (optional). The SQL Sentry Portal comes packaged with the SQL Sentry installer. Download the latest build of SQL Sentry here. Then, follow the SQL Sentry Portal installation instructions.
Once your SQL Sentry installation has been configured and you’ve installed SQL Sentry Portal, you can use Google Chrome or Microsoft Edge to access the SQL Sentry Portal. See SQL Sentry Portal installation instructions for more details.
SolarWinds SQL Sentry
Fast root cause analysis
Visibility across the data estate
Deep, actionable performance metrics with easy deep-dive capabilities