- Events
-
Partners
- Government
- Customer Portal
- Contact Us
- Contact Sales
-
English
If your database performance is slow, the culprit could be SSAS. But troubleshooting SSAS is notoriously challenging. As a DBA, you can use SQL Server Profiler to capture and analyze trace events that are generated by their SSAS instance. You can also use Perfmon to track server and process performance and activity.
To get to the root of SSAS performance problems, you need the ability to go back to any point in time to see how specific events performance may have affected the following:
To accelerate your SSAS Multidimensional or Tabular environment performance, look no further than SSAS performance monitoring capabilities in SQL Sentry.
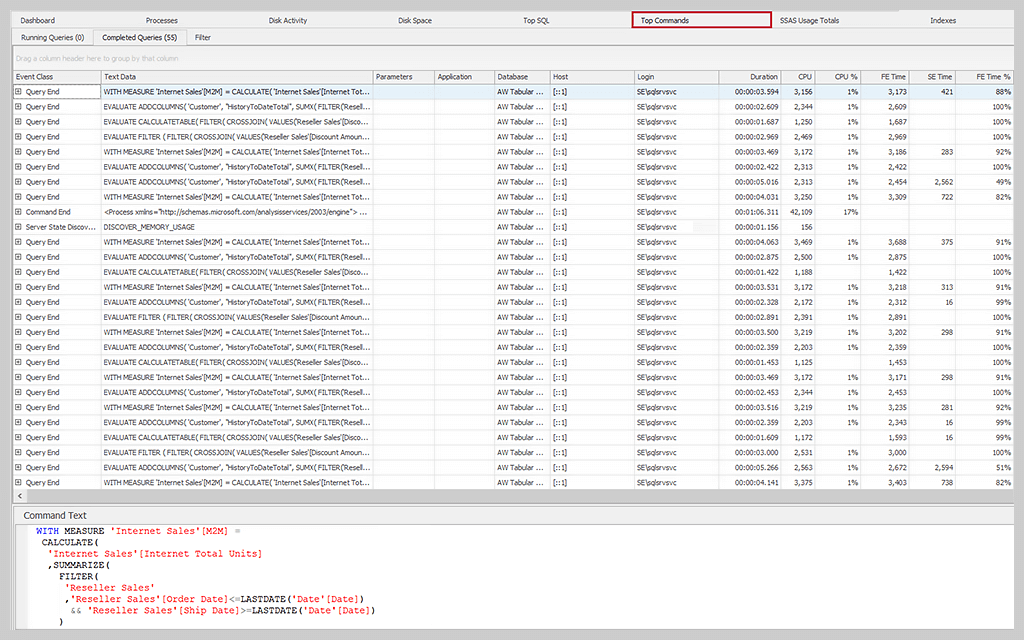
The Top Command tab in the SQL Sentry Performance Analysis Dashboard provides granular insight into what's going on in your SSAS instance. SQL Sentry captures MDX, DAX, DMX, and XMLA commands running in your environment.
You can set the thresholds for collecting these commands, which by default are set to a minimum duration of one second, and you can view the runtime statistics for any command and look at:
By looking at these commands and their associated resource utilization, including CPU, Formula Engine, Storage Engine, Processing, and SQL Query times, you can determine which statements are having the most impact on the performance of your monitored SSAS server.
The Top Commands tab also displays the command text associated with each query in a separate window.
The SQL Sentry Top Commands tab shows SQL Server Analysis Services (SSAS) query-level collection and any MDX, DAX, or XMLA commands that have run longer than one second. All the like queries have been rolled up and grouped together, so you can see their total impact. Top Commands helps you identify and address performance problems with SSAS.
The SQL Sentry Top Commands tab supports SSAS Multidimensional and Tabular modes.
SQL Sentry Top Commands analyzes the performance of MDX, DAX, and XMLA commands.
SQL Sentry Top Commands collect and group SQL Server Profiler trace events by event class, e.g., Command Begin/End and Query Begin/End. You can also filter events by minimum query duration time and others.
SQL Sentry Top Commands allow you to view both running and completed queries. You also have the ability to drill down to individual queries and analyze relevant performance counters.
SolarWinds SQL Sentry
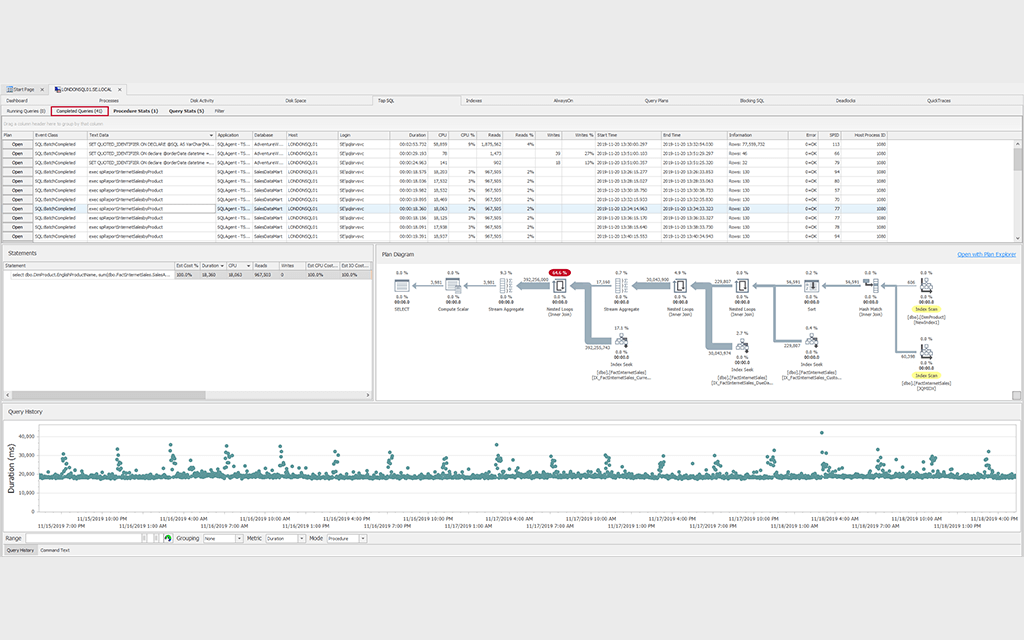
Fast root cause analysis
Visibility across the data estate
Deep, actionable performance metrics with easy deep-dive capabilities