- Events
-
Partners
- Government
- Customer Portal
- Contact Us
- Contact Sales
-
English
Whether you're using Microsoft Azure SQL Database for your SaaS business, enterprise production, or development and testing, under- or over-provisioning resources can mean either a poor user experience or wasted budget.
SQL Sentry helps you monitor performance metrics, including DTU usage, and be notified of events occurring on your system.
SQL Sentry gives you the ability to distinguish consistent performance patterns from anomalies, which is critical to ensuring your data platform delivers optimal performance for end users.
Identifying and resolving query performance bottlenecks is often a time consuming and frustrating task, but it doesn't have to be. The Top SQL view in SQL Sentry provides the detailed information you need to easily troubleshoot query performance problems in Azure SQL Database, including:
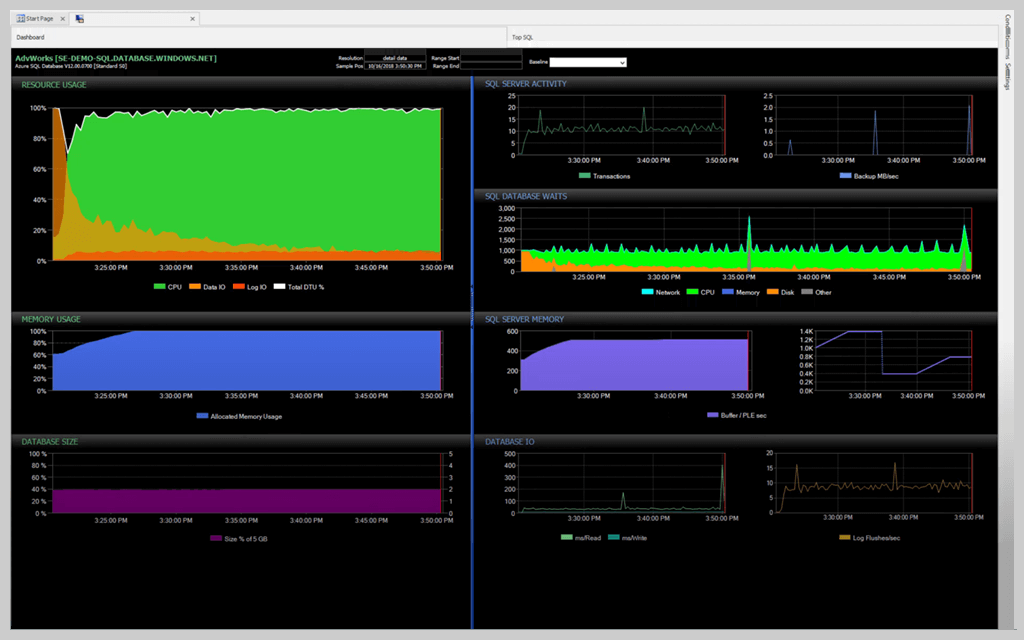
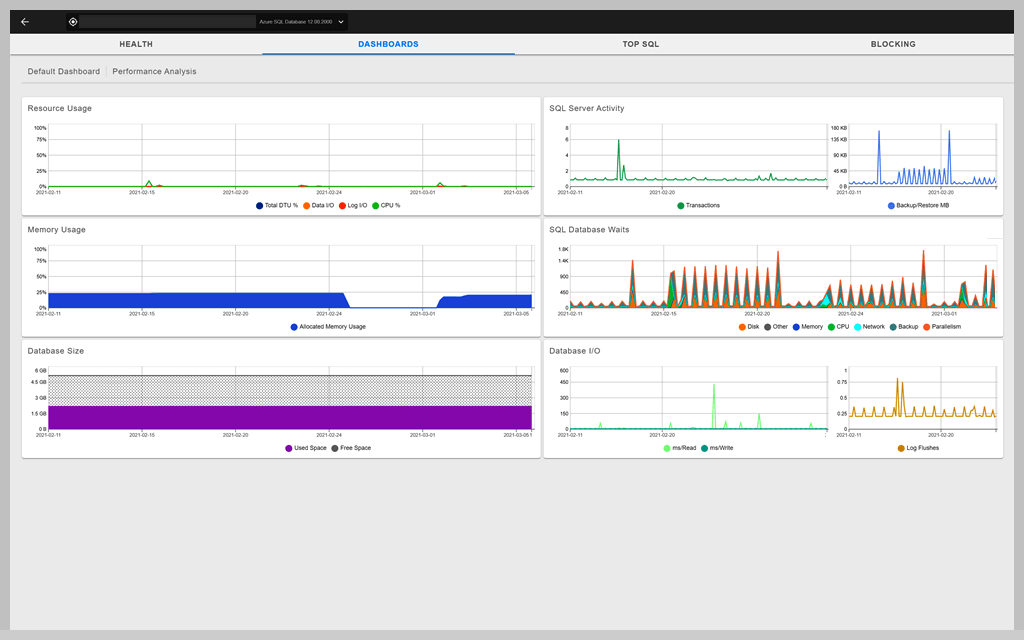
See your DTU usage, database size, memory usage, SQL waits, and more.
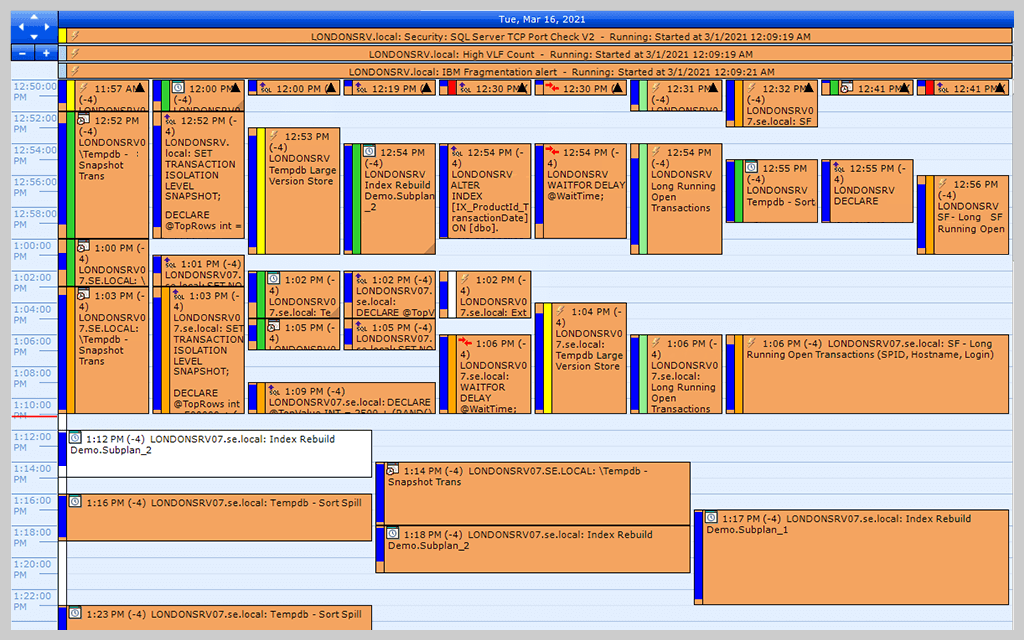
Visualize how specific activities might impact others and jump to run-time performance graphs, which show specific query performance trends and activity details.
When you pay for the data system resources you use, neither overestimating usage nor under-provisioning is a viable option. SQL Sentry helps you optimize performance by providing metrics you can use to better forecast resource allocation based on use.
Using SQL Sentry to monitor Azure SQL Database gives you the ability to see transactions per second, diagnose performance problems with Top SQL, and optimize the data platform with Plan Explorer.
SolarWinds SQL Sentry
Fast root cause analysis
Visibility across the data estate
Deep, actionable performance metrics with easy deep-dive capabilities