- Events
-
Partners
- Government
- Customer Portal
- Contact Us
- Contact Sales
-
English
SQL Server blocking is normal behavior that controls concurrent access to data. Sometimes blocking can harm performance, and these blockers aren’t always easy to locate and resolve. SQL Sentry® offers straightforward visibility into SQL Server blocking. It captures and displays blocking details, including wait types and resources, hosts, databases, and executed statements, based on your specified thresholds. You can view blocking chains in real-time or after the fact.
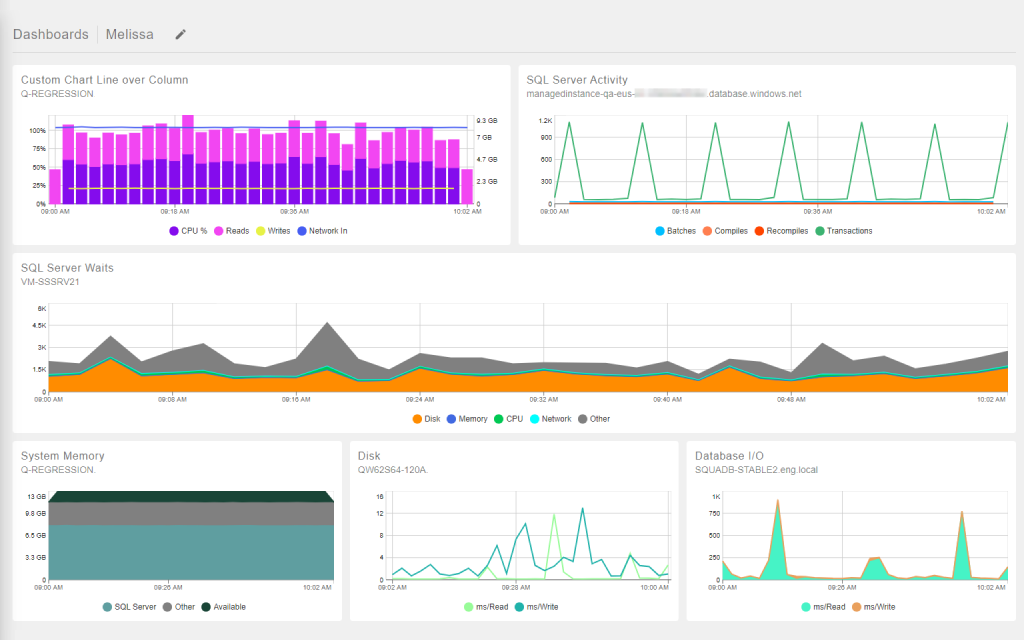
SQL Sentry makes locating SQL Server blockers fast and easy and accelerates the troubleshooting process. A SQL Sentry dashboard displays SQL Server blocking chains in a color-coded hierarchical view showing which statements are running, completed, or blocked. You can even kill blocking processes directly from SQL Sentry. With access to historical performance data, you'll be able to see key SQL Server changes over time, which can make for more effective troubleshooting.
Rather than manually checking blocks in SQL Server, you can use SQL Sentry to easily run the SQL blocking reports you need. SQL Sentry is equipped with more than 25 pre-formatted performance reports so you can understand SQL Server’s performance in minutes. With the help of these reports, you can establish baselines, pinpoint bottlenecks, and gain a better overall understanding of SQL Sentry’s performance both in the moment and over time.
Monitoring SQL Server performance can be a time-consuming process, but SQL Sentry is designed to make it easier with built-in alerts. SQL Sentry is equipped with SQL blocking alert and SQL deadlock alert features and can notify you based on preconfigured conditions so you can immediately tackle issues.
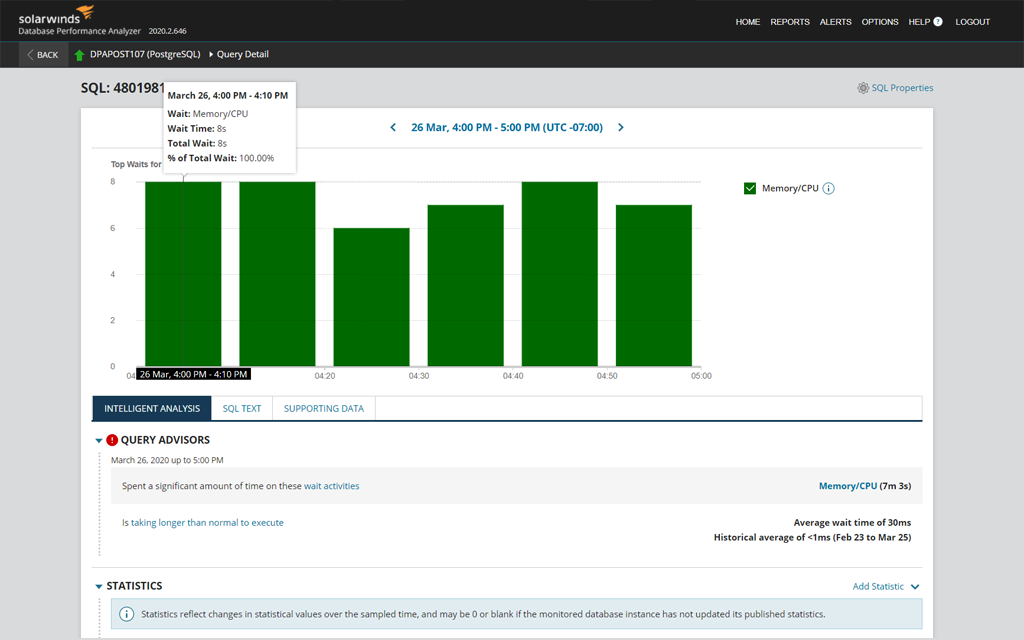
SolarWinds® SQL Sentry is built to collect blocking data. It provides a high level of visibility into the root blocker and its aggregated wait time. This allows database administrators to drill down into the top blocking data and see its impact on database response times. The software can also reveal the top waiters, allowing DBAs to quickly pinpoint their top blockers and use this data to better optimize the queries reducing blocking the most.
Blocks occur when two (or more) processes need to access the same resource simultaneously. When one process requests access to a resource, it’s given a lock that forces other processes that need that resource to wait until the first process is done. In most cases, the second process will wait for the first process to release the lock. Then, things can continue as normal. Typically, this takes a few seconds.
However, sometimes the first process might take longer than expected, causing the second process (and potentially other processes) to pile up behind it as they wait for that resource, which could impact the application’s performance and the end user’s experience. A query’s duration and transaction context determine how long its locks are held.
It’s important to note that not all SQL Server blocking is bad. In fact, blocking is normal. After all, SQL Server is a lock-based concurrency system, and resources can only be accessed by one process at a time. There’s bound to be some overlap at one point or another. It’s the blocks that take longer to resolve and create chains of blockages that are problematic.
Additionally, not all types of locks automatically block all other locks. Some lock types are more restrictive and thus more likely to result in blocks. Some lock types include:
Some lock types are more compatible with others. For example, while exclusive locks aren’t compatible with any other lock types and will result in a block if another process requires the resource, shared and update locks can be on the same resource simultaneously.
It can be easy to confuse deadlocks and blocks, as both occur when two processes need specific resources but can’t access them to complete a query. However, blocking and deadlocks aren’t the same.
Blocking in SQL Server is when two (or more) processes need the same resource. After all, only one process can access a resource at a time. This means that if one process uses a resource, the following process that comes along won’t be able to access the resource until the first process has finished using it.
On the other hand, deadlocks happen when processes try to access different resources. For example, the first process might lock Resource A, while the second process locks Resource B. If the first process needs to put a lock on Resource B to complete and the second needs to put one on Resource A, both operations will grind to a halt, as they’ll be stuck waiting on each other. Essentially, it’s a stalemate.
Luckily, SQL Server can often automatically resolve deadlocks by rolling back one process so the other can continue unimpeded. SQL Server will then restart that second process once the first has finished using the resource.
Two processes are bound to need the same resource at the same time at one point or another, and blocking often resolves itself as soon as the first process is done. However, blocking can be problematic in some instances.
To check blocking in SQL Server, you can use a query to identify the blocking SPID. All you need to do is use SQL Server DMVs and execute a query using the sys.dm_exec_requests DMV. This will return a list of the blocking SPID, any blocked SPIDs, and the wait type and duration.
You can also use SQL Server Management Studio to check blocking in SQL Server and identify the head of a blocking chain. You’ll need to select Server Object, Reports, Standard Reports, and then Activity — All Blocking Transactions. SQL Server Management Studio will then return a report showing the transaction at the top of the blocking chain and any transactions currently blocked by that top transaction.
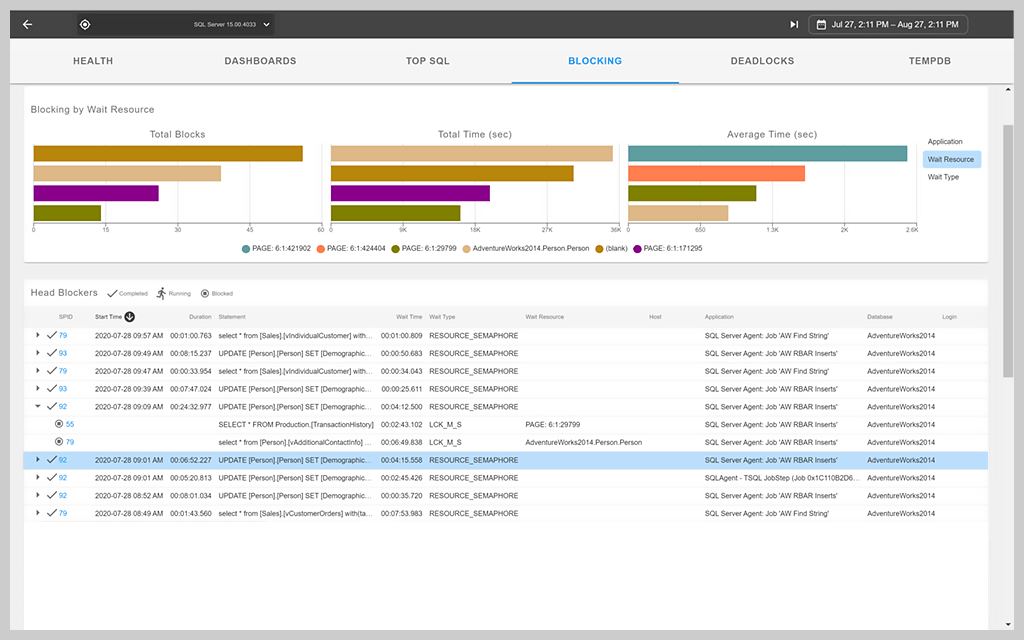
SQL Sentry makes identifying problematic blocking even easier, as it will continuously monitor for SQL Server blocking. With SQL Sentry Event Calendar, you can view blocks alongside other events. Plus, SQL Sentry features robust block analysis and can capture blocking details based on your specific duration thresholds. For example, if you want information about every block that’s longer than ten seconds, SQL Sentry will automatically record data (such as the executed statement, host, login, database, and wait types and resources) on blocks that last more than ten seconds and give you the option to view these details in real-time or later on.
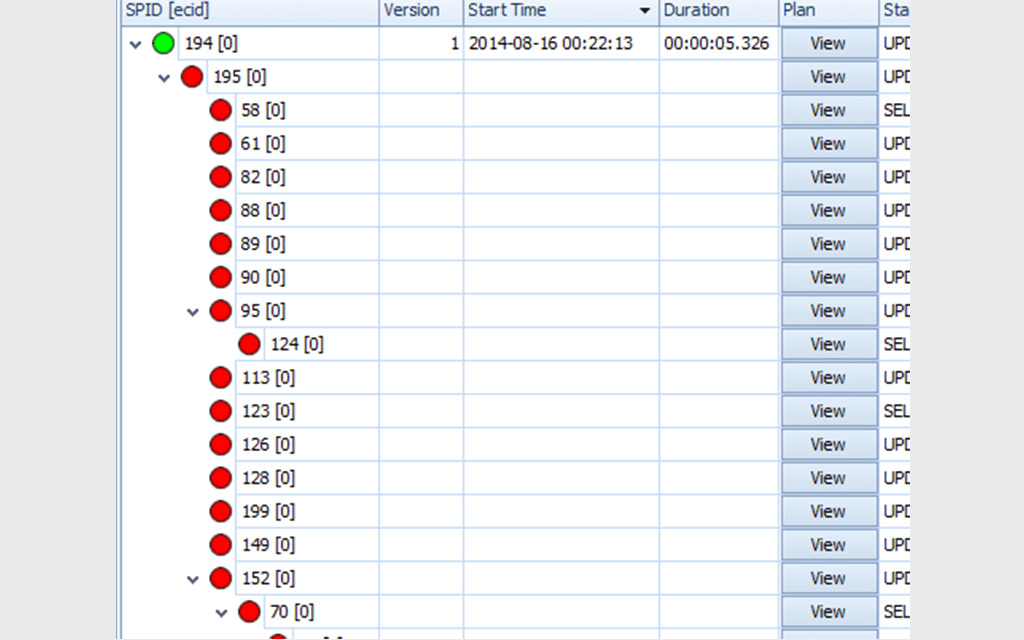
With its hierarchical view and color-coded nodes, SQL Sentry makes it possible to understand a blocking chain at a glance. You’ll instantly know if a statement is running, completed, or blocked. Plus, you can see the relationships between the blocking and blocked SPIDs in the chain, making analysis a breeze.
Once you have identified a problematic block, it’s time to troubleshoot. Common blocking scenarios and solutions you may come across include:
The good news is that SQL Sentry can help, no matter what type of blocking scenario you’re up against. SQL Sentry collects and retains blocking and deadlock data. Not only does this give you a comprehensive view of present performance, but it also allows you to see into the past. Plus, you can see blocking issues in real-time and kill blocking processes from SQL Sentry with one click. With SQL Sentry’s help, you can understand why blocks are occurring and redesign your queries and transactions to prevent them in the future.
SQL Sentry can even take automatic action against blocking SQL conditions for times when you aren’t around. All you need to do is pre-configure SQL Sentry to perform specific actions when conditions are met.
It’s essential for database administrators to know how to find blocking in SQL Server because blocking can cut DBAs off from business-critical resources and prevent them from managing their databases efficiently. However, blocking can be complex and time-consuming to troubleshoot. Here are five of the most common blocking causes:
Still, in a large enterprise with even larger databases, there are many more reasons why a session could be blocked. It would be incredibly challenging for a database administrator to get to the top of the blocking chain and uncover these reasons manually.
Standard SQL Server monitoring tools will display database locking and blocking waits, but they won’t identify the root blocker responsible for the blocking chain. Increased blocking equals slower apps, but how can a database administrator determine whether increased blocking is a sign of database inefficiency or a reason for slow app response times?
Tooling like SQL Sentry can help DBAs get to the bottom of a SQL Server blocking chain, resolve blocks quickly, and get back to business.
Finding blocking isn’t only important when blockers are actively affecting database performance. Since locks and blocks are necessary byproducts of working with SQL Server, DBAs must do all they can to proactively monitor blocking issues or fix the code causing idle blockers. A key part of database management best practices is using software designed to help you find blockers even in their beginning stages.
Blocks occur when two (or more) processes need to access the same resource simultaneously. When one process requests access to a resource, it’s given a lock that forces other processes that need that resource to wait until the first process is done. In most cases, the second process will wait for the first process to release the lock. Then, things can continue as normal. Typically, this takes a few seconds.
However, sometimes the first process might take longer than expected, causing the second process (and potentially other processes) to pile up behind it as they wait for that resource, which could impact the application’s performance and the end user’s experience. A query’s duration and transaction context determine how long its locks are held.
It’s important to note that not all SQL Server blocking is bad. In fact, blocking is normal. After all, SQL Server is a lock-based concurrency system, and resources can only be accessed by one process at a time. There’s bound to be some overlap at one point or another. It’s the blocks that take longer to resolve and create chains of blockages that are problematic.
Additionally, not all types of locks automatically block all other locks. Some lock types are more restrictive and thus more likely to result in blocks. Some lock types include:
Some lock types are more compatible with others. For example, while exclusive locks aren’t compatible with any other lock types and will result in a block if another process requires the resource, shared and update locks can be on the same resource simultaneously.
It can be easy to confuse deadlocks and blocks, as both occur when two processes need specific resources but can’t access them to complete a query. However, blocking and deadlocks aren’t the same.
Blocking in SQL Server is when two (or more) processes need the same resource. After all, only one process can access a resource at a time. This means that if one process uses a resource, the following process that comes along won’t be able to access the resource until the first process has finished using it.
On the other hand, deadlocks happen when processes try to access different resources. For example, the first process might lock Resource A, while the second process locks Resource B. If the first process needs to put a lock on Resource B to complete and the second needs to put one on Resource A, both operations will grind to a halt, as they’ll be stuck waiting on each other. Essentially, it’s a stalemate.
Luckily, SQL Server can often automatically resolve deadlocks by rolling back one process so the other can continue unimpeded. SQL Server will then restart that second process once the first has finished using the resource.
Two processes are bound to need the same resource at the same time at one point or another, and blocking often resolves itself as soon as the first process is done. However, blocking can be problematic in some instances.
To check blocking in SQL Server, you can use a query to identify the blocking SPID. All you need to do is use SQL Server DMVs and execute a query using the sys.dm_exec_requests DMV. This will return a list of the blocking SPID, any blocked SPIDs, and the wait type and duration.
You can also use SQL Server Management Studio to check blocking in SQL Server and identify the head of a blocking chain. You’ll need to select Server Object, Reports, Standard Reports, and then Activity — All Blocking Transactions. SQL Server Management Studio will then return a report showing the transaction at the top of the blocking chain and any transactions currently blocked by that top transaction.
SQL Sentry makes identifying problematic blocking even easier, as it will continuously monitor for SQL Server blocking. With SQL Sentry Event Calendar, you can view blocks alongside other events. Plus, SQL Sentry features robust block analysis and can capture blocking details based on your specific duration thresholds. For example, if you want information about every block that’s longer than ten seconds, SQL Sentry will automatically record data (such as the executed statement, host, login, database, and wait types and resources) on blocks that last more than ten seconds and give you the option to view these details in real-time or later on.
With its hierarchical view and color-coded nodes, SQL Sentry makes it possible to understand a blocking chain at a glance. You’ll instantly know if a statement is running, completed, or blocked. Plus, you can see the relationships between the blocking and blocked SPIDs in the chain, making analysis a breeze.
Once you have identified a problematic block, it’s time to troubleshoot. Common blocking scenarios and solutions you may come across include:
The good news is that SQL Sentry can help, no matter what type of blocking scenario you’re up against. SQL Sentry collects and retains blocking and deadlock data. Not only does this give you a comprehensive view of present performance, but it also allows you to see into the past. Plus, you can see blocking issues in real-time and kill blocking processes from SQL Sentry with one click. With SQL Sentry’s help, you can understand why blocks are occurring and redesign your queries and transactions to prevent them in the future.
SQL Sentry can even take automatic action against blocking SQL conditions for times when you aren’t around. All you need to do is pre-configure SQL Sentry to perform specific actions when conditions are met.
It’s essential for database administrators to know how to find blocking in SQL Server because blocking can cut DBAs off from business-critical resources and prevent them from managing their databases efficiently. However, blocking can be complex and time-consuming to troubleshoot. Here are five of the most common blocking causes:
Still, in a large enterprise with even larger databases, there are many more reasons why a session could be blocked. It would be incredibly challenging for a database administrator to get to the top of the blocking chain and uncover these reasons manually.
Standard SQL Server monitoring tools will display database locking and blocking waits, but they won’t identify the root blocker responsible for the blocking chain. Increased blocking equals slower apps, but how can a database administrator determine whether increased blocking is a sign of database inefficiency or a reason for slow app response times?
Tooling like SQL Sentry can help DBAs get to the bottom of a SQL Server blocking chain, resolve blocks quickly, and get back to business.
Finding blocking isn’t only important when blockers are actively affecting database performance. Since locks and blocks are necessary byproducts of working with SQL Server, DBAs must do all they can to proactively monitor blocking issues or fix the code causing idle blockers. A key part of database management best practices is using software designed to help you find blockers even in their beginning stages.
SolarWinds SQL Sentry
Analyze blocking root causes quickly
Gain visibility across your data estate
Access actionable performance metrics