- Events
-
Partners
- Government
- Customer Portal
- Contact Us
- Contact Sales
-
English
Your NGINX server’s stability depends on optimum utilization of server resources, such as CPU, memory, and disk. However, rogue processes, services, or other network issues can over-utilize these resources and lead to load balancing issues and performance bottlenecks.
SAM helps you avoid server overloads by keeping track of key NGINX performance monitoring statistics and providing insights into load balancing, concurrent client connections, web server traffic and status, CPU utilization, memory usage, and more. With SAM, web server performance monitoring for NGINX can be easier than ever.
With SAM, you can also set up intelligent alerts to catch and solve web server performance issues quickly. Once you pre-configure your performance thresholds, SAM is built to trigger an alert whenever any of those thresholds are met or surpassed. This helps speed up event resolution by pointing you directly at the performance issues that need your attention.
Also, you can use SAM’s custom and templated reports to learn more about what NGINX performance monitoring efforts are working and share that information with your team. Use this information to make NGINX monitoring faster, easier, and more effective in the future.
NGINX is an open-source web server software that offers reverse proxy, email proxy, HTTP caching services, and load balancing on a massive scale. NGINX was originally created to solve the C10k problem—the challenge of handling 10,000 user connections at the same time. NGINX can provide high performance for web servers handling so many users at once, and it’s a popular choice for companies providing high-traffic webpages.
NGINX is often used because it runs quickly and uses resources efficiently. For example, NGINX uses a master and worker process structure instead of creating a process per user. The master process manages the worker processes and handles privileged operations like reading configurations or binding ports. The worker processes manage network connections, read/write operations, and communication with other servers. This structure is considered useful for handling extreme loads and powering faster performance.
NGINX is considered to have excellent scalability because of the way it handles concurrent connections. NGINX separates the connections from the actual processing of said connections, which means a single NGINX thread can handle thousands of concurrent connections as long as the processor speeds can keep up. This ensures memory and CPU usage remain consistent.
NGINX is designed to be a lightweight, scalable, and extremely powerful web server that’s ideal for static content. However, an NGINX monitoring tool can help you get the most out of NGINX.
An NGINX monitoring tool is built to provide comprehensive insights into the availability and performance of NGINX web servers, by offering alerting, reporting, and overall server management capabilities. NGINX performance monitoring tools are designed to monitor metrics that make web server performance monitoring for NGINX much easier.
Accurate and effective NGINX monitoring helps admins test the efficacy of their servers, troubleshoot performance issues in real time, and identify potential issues before they start to affect end-users. But performing NGINX monitoring without an NGINX monitoring tool would be a full-time job in itself. NGINX performance monitoring tools like SolarWinds Server & Application Monitor (SAM) help maximize your time and effort by streamlining and automating the most time-consuming aspects of NGINX monitoring.
Important NGINX monitoring metrics can be divided into two broad categories—metrics related to NGINX itself and metrics related to its underlying infrastructure. Each metric represents the potential threshold for that aspect of the system, and ideally, both your web server and infrastructure will be able to operate efficiently without coming close to these thresholds.
The four most important NGINX-specific monitoring metrics are:
The six most important infrastructure-specific metrics to keep an eye on during NGINX monitoring include:
NGINX OSS is open-source software that’s free to use and download. NGINX Plus is a paid, fully supported web server and load balancer and can be built on top of open-source NGINX.
Public cloud, private cloud, bare-metal environments, virtual machines, or containers can use NGINX Plus to deliver static assets with unmatched speed. NGINX Plus can help admins save time by automating common tasks through the built-in NGINX Plus API.
Other notable features of NGINX Plus that aren’t available in NGINX OSS include:
NGINX Plus is best suited for enterprises that have tried NGINX OSS in the past and want to reduce complexity, do a massive amount of HTTP streaming, or want to transition their web architectures from a monolithic application to a lightweight, distributed, cloud-friendly architecture.
You should consider using NGINX open source if you:
When it comes to NGINX OSS vs. NGINX Plus, consider how much you’re willing to code, how many features you need for the enterprise, and how important technical support and an online community are to you.
Configuring and managing NGINX can be challenging. Even if you manage to configure NGINX correctly, NGINX monitoring is often a complex and time-consuming process.
Some NGINX performance monitoring tools are difficult to configure and can have tedious workflows for capturing even the most basic NGINX monitoring metrics. With these tools, there’s not an easy way to monitor infrastructure dependencies, making it much harder to find and remediate problems.
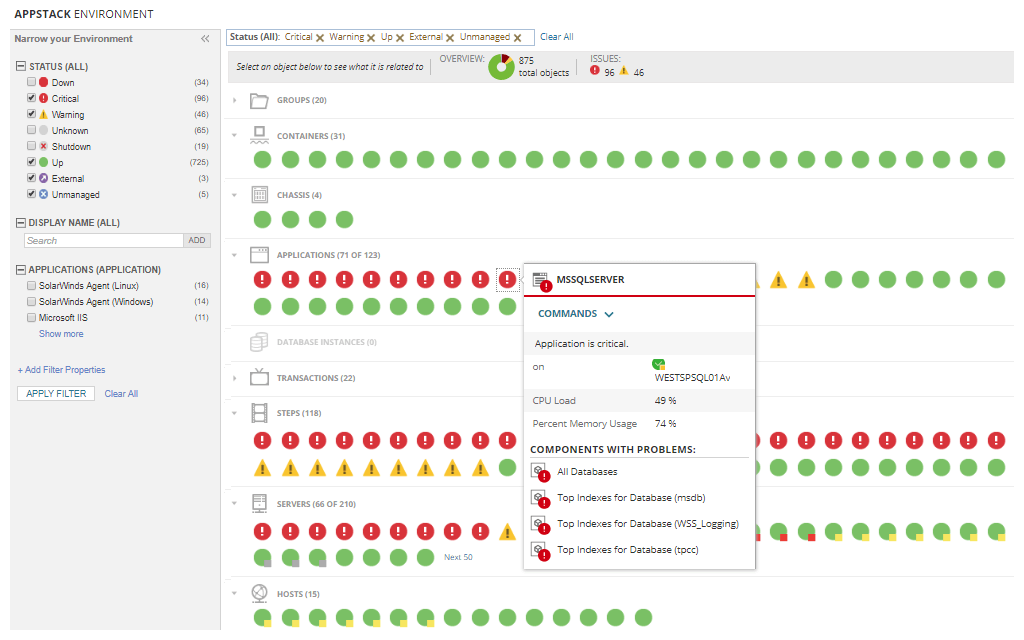
SolarWinds Server & Application Monitor (SAM) is a robust NGINX monitoring tool built to help you more effectively monitor NGINX and quickly pinpoint the root cause of performance issues faster. From one tool, you can monitor your entire on-premises, cloud, and hybrid application environment. The included 1,200+ out-of-the-box and available 1,000 community application monitoring templates can also make it easier to keep an eye on your entire system.
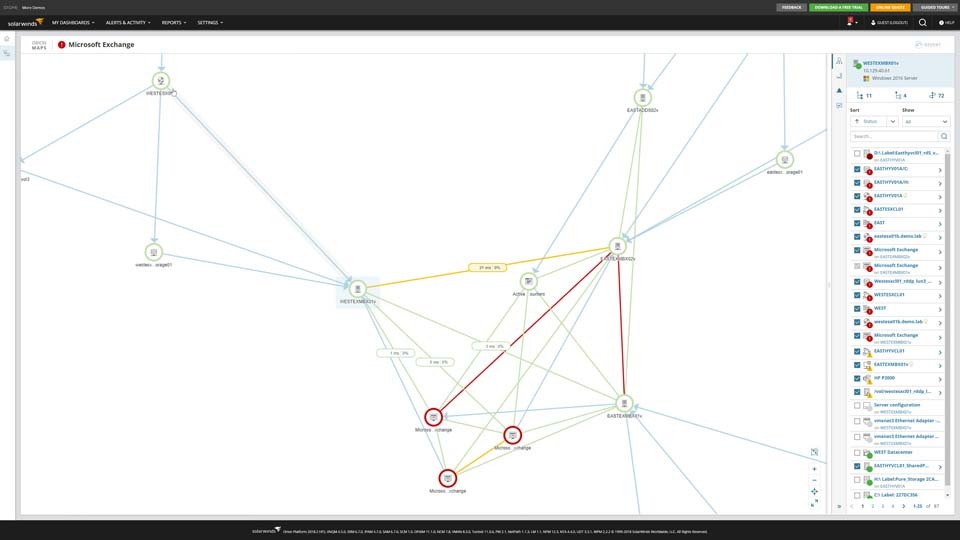
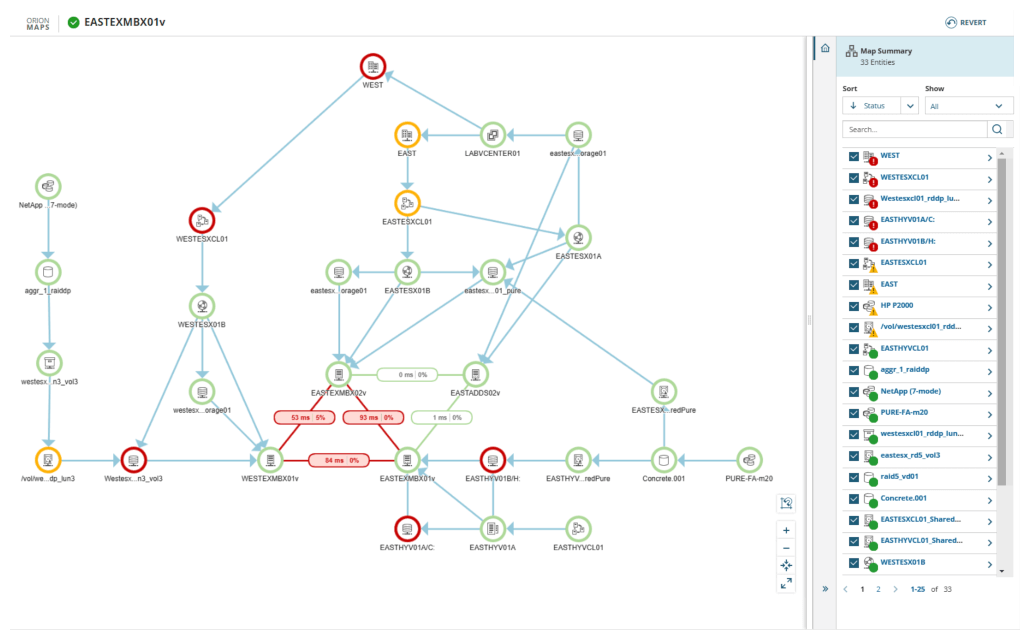
SAM has numerous features designed to facilitate fast and effective NGINX monitoring. This software can help you keep track of key NGINX performance monitoring metrics like requests per second and request processing time, so you can ensure NGINX is running optimally. Dependency mapping and cross-stack IT data correlation features can also help you drill down on performance issues and isolate root causes as soon as possible.
NGINX is an open-source web server software that offers reverse proxy, email proxy, HTTP caching services, and load balancing on a massive scale. NGINX was originally created to solve the C10k problem—the challenge of handling 10,000 user connections at the same time. NGINX can provide high performance for web servers handling so many users at once, and it’s a popular choice for companies providing high-traffic webpages.
NGINX is often used because it runs quickly and uses resources efficiently. For example, NGINX uses a master and worker process structure instead of creating a process per user. The master process manages the worker processes and handles privileged operations like reading configurations or binding ports. The worker processes manage network connections, read/write operations, and communication with other servers. This structure is considered useful for handling extreme loads and powering faster performance.
NGINX is considered to have excellent scalability because of the way it handles concurrent connections. NGINX separates the connections from the actual processing of said connections, which means a single NGINX thread can handle thousands of concurrent connections as long as the processor speeds can keep up. This ensures memory and CPU usage remain consistent.
NGINX is designed to be a lightweight, scalable, and extremely powerful web server that’s ideal for static content. However, an NGINX monitoring tool can help you get the most out of NGINX.
An NGINX monitoring tool is built to provide comprehensive insights into the availability and performance of NGINX web servers, by offering alerting, reporting, and overall server management capabilities. NGINX performance monitoring tools are designed to monitor metrics that make web server performance monitoring for NGINX much easier.
Accurate and effective NGINX monitoring helps admins test the efficacy of their servers, troubleshoot performance issues in real time, and identify potential issues before they start to affect end-users. But performing NGINX monitoring without an NGINX monitoring tool would be a full-time job in itself. NGINX performance monitoring tools like SolarWinds Server & Application Monitor (SAM) help maximize your time and effort by streamlining and automating the most time-consuming aspects of NGINX monitoring.
Important NGINX monitoring metrics can be divided into two broad categories—metrics related to NGINX itself and metrics related to its underlying infrastructure. Each metric represents the potential threshold for that aspect of the system, and ideally, both your web server and infrastructure will be able to operate efficiently without coming close to these thresholds.
The four most important NGINX-specific monitoring metrics are:
The six most important infrastructure-specific metrics to keep an eye on during NGINX monitoring include:
NGINX OSS is open-source software that’s free to use and download. NGINX Plus is a paid, fully supported web server and load balancer and can be built on top of open-source NGINX.
Public cloud, private cloud, bare-metal environments, virtual machines, or containers can use NGINX Plus to deliver static assets with unmatched speed. NGINX Plus can help admins save time by automating common tasks through the built-in NGINX Plus API.
Other notable features of NGINX Plus that aren’t available in NGINX OSS include:
NGINX Plus is best suited for enterprises that have tried NGINX OSS in the past and want to reduce complexity, do a massive amount of HTTP streaming, or want to transition their web architectures from a monolithic application to a lightweight, distributed, cloud-friendly architecture.
You should consider using NGINX open source if you:
When it comes to NGINX OSS vs. NGINX Plus, consider how much you’re willing to code, how many features you need for the enterprise, and how important technical support and an online community are to you.
Configuring and managing NGINX can be challenging. Even if you manage to configure NGINX correctly, NGINX monitoring is often a complex and time-consuming process.
Some NGINX performance monitoring tools are difficult to configure and can have tedious workflows for capturing even the most basic NGINX monitoring metrics. With these tools, there’s not an easy way to monitor infrastructure dependencies, making it much harder to find and remediate problems.
SolarWinds Server & Application Monitor (SAM) is a robust NGINX monitoring tool built to help you more effectively monitor NGINX and quickly pinpoint the root cause of performance issues faster. From one tool, you can monitor your entire on-premises, cloud, and hybrid application environment. The included 1,200+ out-of-the-box and available 1,000 community application monitoring templates can also make it easier to keep an eye on your entire system.
SAM has numerous features designed to facilitate fast and effective NGINX monitoring. This software can help you keep track of key NGINX performance monitoring metrics like requests per second and request processing time, so you can ensure NGINX is running optimally. Dependency mapping and cross-stack IT data correlation features can also help you drill down on performance issues and isolate root causes as soon as possible.
Server & Application Monitor
Monitor real-time processes in your server for memory, CPU, and disk I/O with an NGINX monitoring tool.
Get NGINX monitoring, reporting, alerting, and asset inventory in one product.
Use custom monitors or modify built-in templates for NGINX monitoring, servers, applications, and more.