- Events
-
Partners
- Government
- Customer Portal
- Contact Us
- Contact Sales
-
English
NPM uses simple network management protocol (SNMP) monitoring to automatically discover devices across your network. You can then easily map out intra-network connections, showing connections between endpoints. With NPM’s automated capabilities, gathering this data can be quicker and more accurate.
By aggregating and visualizing this data, you gain valuable visibility into your network, including device dependencies that may be at the root of a specific network issue. Maps can help you understand root causes faster, especially for complex environments. As a result, you stand to boost network uptime and more easily achieve optimal performance.
NPM provides the network monitoring tools you need to keep apprised of network problems and plan to avoid future issues. With NPM, you can automatically calculate exhaustion dates, drawing from customizable thresholds according to average and peak usage data. Capture key metrics for forecasting, including memory usage on nodes, CPU utilization on nodes, space usage on volumes, receive utilization on interfaces, and transmit utilization on interfaces.
Alerting and reporting provide invaluable insights into network performance. NPM sends real-time, topology-aware alerts with information to help you start troubleshooting. Use built-in or custom network alerts, and set alert time windows and delivery methods such as email or text, so you can control your level of visibility and more easily keep your focus on critical notifications.
NPM makes it simple to run reports showing detailed information for your network, whether current or historical. Schedule regular reports or run ad hoc reports as needed.
With NPM’s built-in PerfStack™ dashboard, you can expedite troubleshooting by using cross-stack network data correlations. By dragging and dropping network performance metrics, including disparate data types, within a common timeline, you can more easily detect root causes adversely affecting network functionality.
NPM’s NetPath™ feature is built to provide hop-by-hop network analysis along critical paths. NetPath helps you easily view traffic and performance details across applications and devices on site, in the cloud, or within hybrid environments.
Together, these tools can help you effectively locate a network issue and quickly fix the problem at hand. Since NPM shares data from the entire IT stack across teams, collaboration across functional teams can be more seamless and successful than ever before.
A network monitoring tool consists of features to detect, diagnose, and resolve network performance issues by scanning network devices for fault and availability.
Network monitoring software integrates with your network components. It’s built to integrate with various devices and services, including routers, servers, firewalls, switches, and virtual machines. This integration or data connection can occur through protocols like packet sniffing, APIs, Simple Network Management Protocol (SNMP), Internet Control Message Protocol (ICMP), and Windows Management Instrumentation (WMI). For instance, an SNMP agent is typically built into network elements, so admins can allow SNMP read-write access to control and reconfigure devices through the network monitoring system.
Network monitoring solutions capture metrics at specific intervals. It’s important for a network monitor to offer admins insight into measurements indicative of the health and performance of network components. For instance, key metrics for measuring traffic include latency, packet errors, TCP retransmits, and packet metadata.
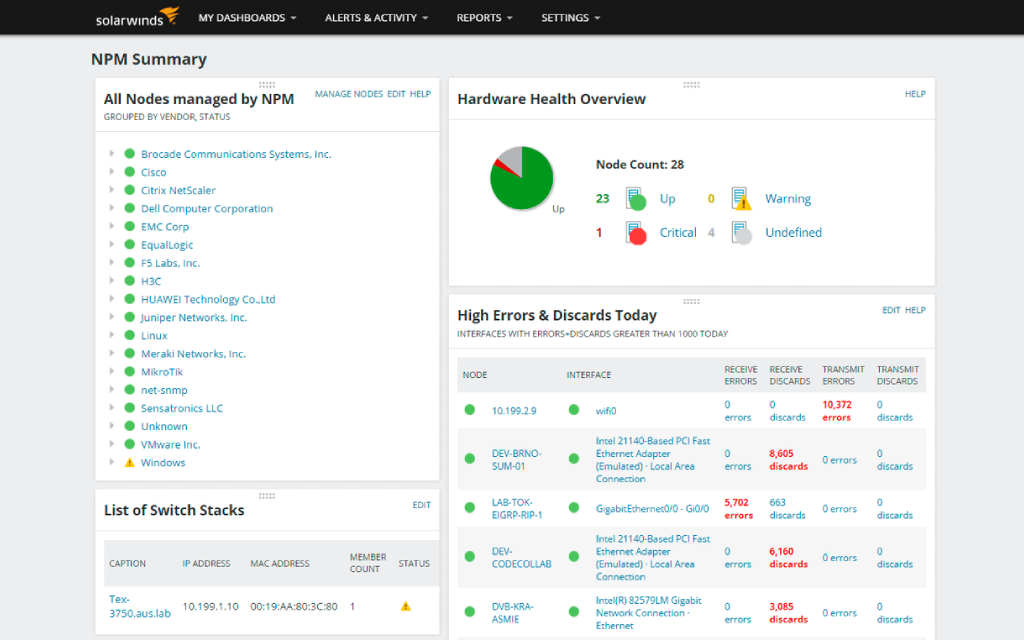
Monitoring tool supports proactive visibility and troubleshooting, including a dashboard displaying metrics in an intuitive fashion by providing an at-a-glance view of your network status.
Ultimately, the point of these capabilities is to optimize network performance and maintain availability across your network while avoiding fault, downtime, or any connectivity issue that could impact your business.
Network monitoring software is critical for ensuring network performance and health, which in turn support overall business functionality, productivity, and security. Network outages can cause severe losses for businesses, as they affect both day-to-day internal operations and external functions like websites and sales.
The high cost of network failure—or even momentary downtime—means a proactive, comprehensive, and professional network monitoring solution can be well worth the investment. The right network monitoring software can make all the difference for your organization by allowing you to perform the following tasks, each of which is critical to ensuring overall business productivity.
There are a lot of benefits network monitoring tools can offer you. For example:
Network monitoring software offers automated features for forecasting, alerting, and reporting, allowing you to automatically calculate exhaustion dates using thresholds based on peak and average usage.
While a network monitoring tool often has many features, it relies on core functions to get the job done. A tool works by connecting to various network elements, analyzing packet traffic, capturing relevant device metrics, and presenting this information in a useful format.
A network monitoring tool connects to various network components. It can connect to the devices you’d like to manage as nodes within the program in different ways. One common way is through the SNMP protocol, a standard for collecting data on IP networks typically supported on modems, routers, servers, printers, workstations, switches, and more. It uses the management information base (MIB) to query variables and change them if needed.
Another option is ICMP, an error-reporting protocol that generates error messages regarding packet delivery—useful information when troubleshooting latency issues and more.
Additionally, monitoring tools may use WMI, a Microsoft-specific method of providing users with information about local or remote computer system status. WMI can allow monitoring tools to implement system setting changes.
Network monitoring tools track traffic. Understanding network traffic often comes down to monitoring packet activity. Investigating network traffic anomalies at this level is a standard way to get to the root cause of performance issues. Packet information can also enable the admin to understand how much data is currently crossing your network, especially when compared to historical baselines.
A network monitoring tool displays information using visual maps. While network monitor dashboards should provide data in different ways—including charts, graphs, alerts, and reports—visual network maps are especially useful when monitoring network performance, as they’re built to provide useful, at-a-glance overviews of the relationships and current statuses of network components.
Sensor and protocol compatibility. Supporting common ways of collecting data, including packet sniffing, APIs, SNMP, ICMP, and WMI.
Multi-vendor compatibility. You need insight into devices from multiple vendors. SolarWinds NPM supports vendors like Cisco Nexus, ASA, and ACI, as well as Huawei NetStream, F5 BIG-IP, and more.
Advanced alerting. Move beyond basic alerting by defining network performance alerts based on nested trigger conditions, parent/child dependencies, and network topologies.
Path visualization. Hop-by-hop analysis of cloud and on-prem applications and services can let you see changes along a path, more easily identify service provider issues, and use historical views to identify potential performance issues in the path before a problem occurs.
Performance analysis. When it comes to performance issues, streamlined analysis features can help accelerate the identification of root causes.
Intelligent mapping. It can be easier to catch problems and understand issues with at-a-glance visualizations of the relationships between routers, switches, interfaces, and other elements.
Network Performance Monitor offers other powerful network monitoring features. Click here to learn more.
SolarWinds Network Performance Monitor (NPM) is a proven automated network monitoring tool that enables discovery and monitoring across network devices, including common devices like firewalls, switches, and load balancers.
NPM can be used as an effective network monitoring tool for assessing performance across F5 BIG-IP load balancers, Cisco ASA and Palo Alto Networks firewalls, Cisco Nexus switches, and more. You can analyze UCS devices, as well as the cloud, hardware health, virtual environment, containers, and the quality of experience. Beyond UCS devices, NPM is designed for various Cisco devices, including Nexus, ACI, ASA, EnergyWise and SwitchStacks.
NPM’s advanced-network troubleshooting capabilities work for applications and devices on-premises, in the cloud, and across hybrid environments.
As part of device monitoring, NPM is built to detect, diagnose, and resolve network performance problems or breakdowns. NPM uses the Network Insight™ features to generate key insights and create data visualizations to help evaluate the performance and health of advanced network devices. This tool tracks pertinent data associated with each device’s unique role within a given network.
SolarWinds Network Performance Monitor not only monitors any wireless controller or 802.11 IEEE-compliant autonomous access point (AP), but also provides comprehensive insights regarding wireless clients, wireless controllers, access points, thin APs, and rogue APs. Once wireless devices become added to the SolarWinds Orion® database, NPM is designed to automatically recognize wireless APs and controllers.
The wireless interfaces are not identified amid the discovery process. Instead, when each wireless device becomes added to your network, NPM performs an automatic inventory search. The polling begins once each wireless interface found gets added to the database.
Within NPM, you can easily view data across your wireless networks. The Wireless Summary view presents a list of all wireless access points (APs), as well as the clients connected to each AP.
With NPM, if you’ve already deployed an earlier iteration of the Wireless Network module to poll your wireless devices, historical data automatically migrates to the newer format. The wireless migration occurs in batches during routinely scheduled database maintenance. The migration notifies users as soon as a node becomes migrated, as well as when all nodes become migrated in the event log. Note that viewing of historical data does not become immediately available since this process is throttled.
SolarWinds offers different NPM licensing packages. To mobilize NPM’s network monitoring tools, the installation process first begins by asking you to activate your selected NPM license. To input your NPM license, you will need your license key readily available. Your NPM license can be found within the SolarWinds Customer Portal. Your NPM license works in tandem with any additional SolarWinds licenses you may have previously purchased. Using an administrator account, you can easily access your NPM License Summary at any point by logging in to the SolarWinds Web Console. This means you can always see the number of component monitors that have been consumed and remain available within your license.
To access SolarWinds broader array of services, we offer two primary licensing models:
Meanwhile, the specific NPM licensing model provides different licensing options depending on the services—and volume of services—bought. Our flexible NPM licensing model scales accordingly with the maximum limit of nodes, volumes and interfaces purchased to monitor. NPM’s licensing models are based on the largest number of selected network elements—meaning volumes, interfaces, and nodes—to be monitored.
NPM’s network monitoring tools can be bought at five different licensing tiers. The five licensing levels include the SL100, SL250, SL500, SL2000, and SLX licenses—and directly correspond to the level of nodes, interfaces and volumes included within each given licensing model.
Nodes include monitored devices, such as routers, modems, access points, switches, as well as all physical and virtual servers. Interfaces, meanwhile, capture any single points of network traffic, such as physical and virtual interfaces, sub-interfaces, VLANs, and switch ports. Volumes refer to any logical disks being monitored.
A network monitoring tool consists of features to detect, diagnose, and resolve network performance issues by scanning network devices for fault and availability.
Network monitoring software integrates with your network components. It’s built to integrate with various devices and services, including routers, servers, firewalls, switches, and virtual machines. This integration or data connection can occur through protocols like packet sniffing, APIs, Simple Network Management Protocol (SNMP), Internet Control Message Protocol (ICMP), and Windows Management Instrumentation (WMI). For instance, an SNMP agent is typically built into network elements, so admins can allow SNMP read-write access to control and reconfigure devices through the network monitoring system.
Network monitoring solutions capture metrics at specific intervals. It’s important for a network monitor to offer admins insight into measurements indicative of the health and performance of network components. For instance, key metrics for measuring traffic include latency, packet errors, TCP retransmits, and packet metadata.
Monitoring tool supports proactive visibility and troubleshooting, including a dashboard displaying metrics in an intuitive fashion by providing an at-a-glance view of your network status.
Ultimately, the point of these capabilities is to optimize network performance and maintain availability across your network while avoiding fault, downtime, or any connectivity issue that could impact your business.
Network monitoring software is critical for ensuring network performance and health, which in turn support overall business functionality, productivity, and security. Network outages can cause severe losses for businesses, as they affect both day-to-day internal operations and external functions like websites and sales.
The high cost of network failure—or even momentary downtime—means a proactive, comprehensive, and professional network monitoring solution can be well worth the investment. The right network monitoring software can make all the difference for your organization by allowing you to perform the following tasks, each of which is critical to ensuring overall business productivity.
There are a lot of benefits network monitoring tools can offer you. For example:
Network monitoring software offers automated features for forecasting, alerting, and reporting, allowing you to automatically calculate exhaustion dates using thresholds based on peak and average usage.
While a network monitoring tool often has many features, it relies on core functions to get the job done. A tool works by connecting to various network elements, analyzing packet traffic, capturing relevant device metrics, and presenting this information in a useful format.
A network monitoring tool connects to various network components. It can connect to the devices you’d like to manage as nodes within the program in different ways. One common way is through the SNMP protocol, a standard for collecting data on IP networks typically supported on modems, routers, servers, printers, workstations, switches, and more. It uses the management information base (MIB) to query variables and change them if needed.
Another option is ICMP, an error-reporting protocol that generates error messages regarding packet delivery—useful information when troubleshooting latency issues and more.
Additionally, monitoring tools may use WMI, a Microsoft-specific method of providing users with information about local or remote computer system status. WMI can allow monitoring tools to implement system setting changes.
Network monitoring tools track traffic. Understanding network traffic often comes down to monitoring packet activity. Investigating network traffic anomalies at this level is a standard way to get to the root cause of performance issues. Packet information can also enable the admin to understand how much data is currently crossing your network, especially when compared to historical baselines.
A network monitoring tool displays information using visual maps. While network monitor dashboards should provide data in different ways—including charts, graphs, alerts, and reports—visual network maps are especially useful when monitoring network performance, as they’re built to provide useful, at-a-glance overviews of the relationships and current statuses of network components.
Network Performance Monitor
Easily discover and monitor an array of network devices
Use NetPath and PerfStack for deeper network analysis
Get the insights you need with wireless network monitoring