- Events
-
Partners
- Government
- Customer Portal
- Contact Us
- Contact Sales
-
English
Easily search and filter your CDRs and CMRs to isolate the affected call.
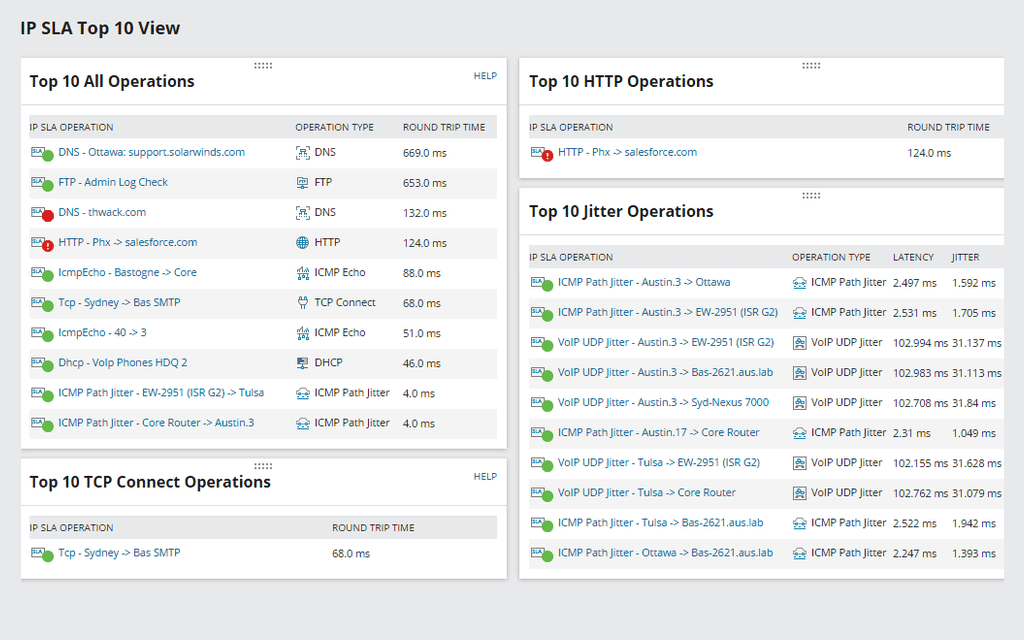
View VoIP call signaling, call path details, and the corresponding IP SLA operation.
Get details on VoIP problems like data distribution, PRI trunk utilization, top quality issues, and failed calls.
Get status, health, and utilization details on SIP and CUBE trunks, and correlate metrics in the PerfStack™ dashboard.
When alerted to poor call quality by either an alert or a user complaint, you can easily search and filter your call detail records (CDRs) and call management records (CMRs) to isolate the affected call. Search criteria includes Call Origination and Destination (phone number, IP address, region, gateway/endpoint), Call Manager, Call Time, Call Status, and Call Quality. Search for all calls within the last 15 minutes with a critical MOS score then select the appropriate call to view call details and begin troubleshooting.
Once you have isolated the affected call, you can view specific call details, including VoIP call signaling, call path details, and the corresponding IP SLA operation. In this example, jitter and latency for the call are high and correlate with HOP 1 of the SLA operation path. Call paths are correlated to an IP SLA operation path where you can view RTT and monitor jitter and latency. By clicking on the IP address of HOP 1, you will be presented with IP SLA operation details to begin troubleshooting potential network issues.
The VoIP PRI gateway view provides VoIP gateway and performance details, including PRI trunk and channel utilization, distribution of VoIP and data, and a list of the top 10 quality issues through a designated gateway, allowing you to see exactly how your VoIP capacity is being used and identify potential issues before they affect users.
Obtain detailed status, health, and utilization information for SIP trunks and CUBE trunks, and audio and video call activity. SIP and CUBE trunk call activity and availability is displayed in the PerfStack dashboard, enabling admins to identify the root cause of Cisco SIP call failures by correlating SIP trunk and CUBE trunk availability, VoIP call performance metrics, and corresponding network performance metrics, including CPU and memory utilization.
Identify the root cause of SIP call failures by correlating SIP trunk availability and activity, VoIP call performance metrics, and corresponding network performance metrics (including CPU and memory utilization) using the PerfStack dashboard. By correlating performance metrics on a common timeline, you can identify the root cause on your network or determine if you need to contact your SIP provider.
When integrated with SolarWinds® Network Performance Monitor (NPM), you can view additional detailed performance metrics, including interface status, utilization, and latency, and response time of the IP SLA source device for further troubleshooting.
VoIP & Network Quality Manager
Real-time WAN monitoring and alerting of site-to-site WAN performance.
Use CDR Analysis to quickly pinpoint VoIP performance problems.
Powerful VoIP monitoring tools for Cisco devices can help you see the big picture of how a call transits your network.