- Events
-
Partners
- Government
- Customer Portal
- Contact Us
- Contact Sales
-
English
SolarWinds® VoIP & Network Quality Manager (VNQM) is your one-stop shop for comprehensive Internet Protocol Service-Level Agreement (IP SLA) monitoring. Configure devices to run customized diagnostic tests for a 360-degree picture of your network’s overall performance. Choose to run existing network service assurance operations or create new ones worth supervising. From HTTP to UDP jitter, VNQM makes it easy to monitor several IP SLA operations simultaneously so you can better manage WAN health.
Using Cisco IP SLA and Juniper real-time performance monitoring (RPM), VNQM eliminates the hassle of writing command-line operations for each device. Automatically link network service assurance operations to your Cisco and Juniper RPM devices to start collecting vital performance metrics. Dig into problem nodes and compare historical data to easily spot problems and gain at-a-glance insight. Monitor the performance of your network while using an intuitive tool with easy configuration.
Get detailed information about network and device latency, jitter, packet loss, and mean opinion scores (MOS) through automatic polling. VNQM measures synchronization issues, response times, data loss, call quality, failing nodes, and more through regular polling, so the data you see is always up-to-date. By using SolarWinds VNQM, you can acquire real-time and historical statistics providing quality of service (QoS) measurements regarding network paths between a source device and a target.
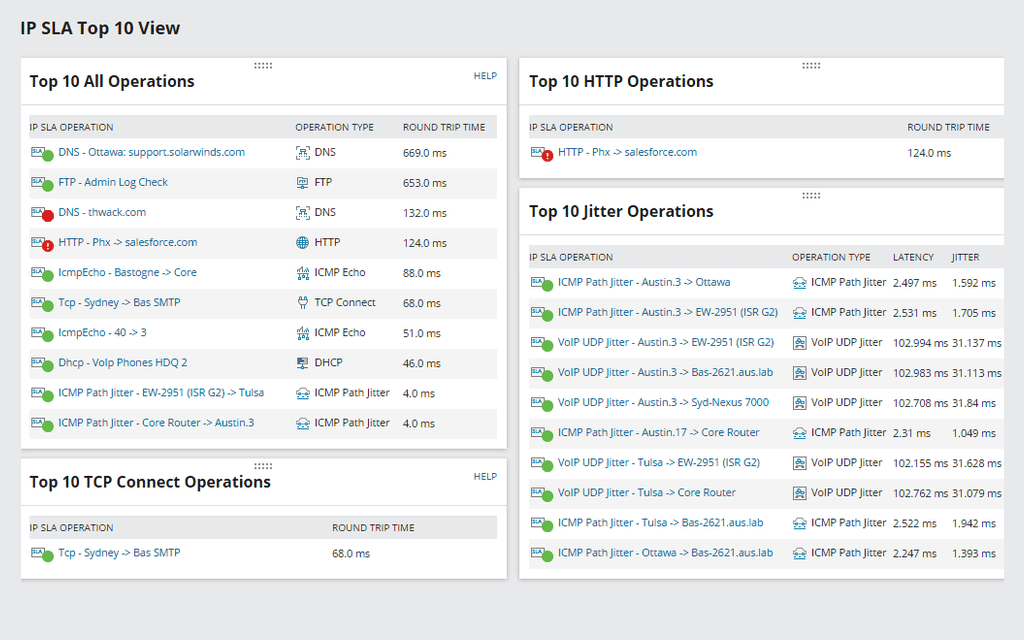
VNQM collects useful information and displays it in tables, graphs, charts, and a variety of other easily digestible formats. With dashboard views, you can home in on problem areas and identify sources of latency and disruption within your network. For a quick overview of how your network is doing, VNQM generates a MOS to give you a snapshot of your network quality, speed, and connectivity times.
Obtain regular logs only including the information most valuable to you. SolarWinds VNQM lets you predefine how you want to generate data reports. Schedule automatic email reports to keep you in the loop, or print out your reports with the click of a button. VNQM transforms record keeping and data management from an overwhelming and complex task to a simple and convenient one—all while providing the most valuable information.
IP SLA is a diagnostic tool designed by Cisco IOS to help users analyze network performance. It works by actively and continuously collecting data from components within the network—data such as device connectivity rates, communication latency, packet loss, server or site downtime, and other information giving administrators insight into the health of their IT infrastructure.
Though this process varies depending on the types of operations being supervised, IP SLA monitoring generally works with the help of an IP SLA router and an IP SLA Responder. The router generates network traffic, and the Responder gathers information and facilitates the reporting process. The IP SLA router sends the originating timestamp (which states when the data packet was sent) to the Responder. Once this is received, the Responder inputs a receive timestamp (which states when the Responder received the packet) and a transmit timestamp (which tells users when the data packet was sent to its final destination).
From this process, an IP SLA monitor can gauge how well and how quickly devices can communicate with each other across the network. For example, if the data packet takes a long time to transfer between the router and Responder, it tells you there’s a latency or operational issue.
IP SLA monitoring and network service assurance management are practically the same. Both terms encompass the internal policies, algorithms, and methods used to gauge device performance and network health. The main difference lies in what devices are being monitored and managed.
Cisco developed IP SLA to analyze traffic data in real time, so many of its features and capabilities are only compatible with Cisco and network management system (NMS) devices and their peripheral endpoints. Network service assurance management is an updated version of IP SLA and extends its diagnostic tools to Juniper RPM and a few other external vendor devices. This helps eliminate technology silos capable of leaving blind spots across a network and making it harder for administrators to locate untraceable problem areas.
Though IP SLA operations are beneficial for data analytics and troubleshooting, they can cause more harm to your network if polling frequencies, testing schedules, and other monitoring features are deployed too often or consistently overlap.
Configuration issues have become more common as today’s standard offices and residences have embraced smart technology and interconnected mesh networks. The more devices and operations you integrate into your IP SLA monitoring software, the more data packets will be sent to and from your devices, meaning your network will have to work to ensure all components are running smoothly despite the increase in traffic.
This also means your monitoring system will become less effective. The more data and devices you try to keep track of, the harder it will be to stay on top of all recorded logs and historical results. To ensure you use IP SLA operations correctly, make sure to do the following:
SolarWinds VNQM is the ultimate IP SLA monitor, providing granular and scalable insight into your network’s performance metrics. You can add IP SLA operations already existing on your devices to VNQM or create your own network service assurance operations to conduct.
The network service assurance operations VNQM supports include the following:
Setting up VNQM isn’t a difficult process. You just have to ensure you account for all devices, routers, and servers.
To start, install SolarWinds VNQM using the SolarWinds Platform installer guide for a detailed list of system requirements and instructions. After installing VNQM, discover and add your Juniper RPM, Cisco, and Network service assurance-compatible devices.
You’ll then need to add your Cisco router to VNQM and enable access via SNMP read/write, SSH, or CLI through Telnet. This allows VNQM to deploy network service assurance operations. After your Cisco router is connected, configure VNQM to conduct the operations you want to get the data you wish to monitor. For detailed steps, you can use the “Add network service assurance operations to SolarWinds VNQM” instruction page.
Once you complete your operations checklist, you can view incoming data on the SolarWinds Platform Web Console dashboard. From here, you can spot and troubleshoot flagged problem areas and set up alerts to automatically notify you of issues requiring immediate attention.
Don’t forget to include VoIP operation capabilities. Add Avaya or Cisco call managers to VNQM so the program can authenticate service accounts and facilitate communication and testing using call data packets. For VNQM to receive data from your call managers, ensure you’ve configured these devices to send data to VNQM. Soon after, VNQM will start gathering and analyzing data to help you conceptualize how well your VoIP services are running.
If you need further assistance installing, configuring, and navigating this IP SLA monitor, please see our step-by-step guide here.
VoIP & Network Quality Manager
Leverage QoS metrics to analyze real-time and historical data
Discover, add, and configure devices to poll the data you want
Directly troubleshoot pain points on a user-friendly, visually engaging dashboard