- Events
-
Partners
- Government
- Customer Portal
- Contact Us
- Contact Sales
-
English
.NET monitoring can become complex and labor-intensive if your server handles many different applications at the same time. By the time you have your Microsoft .NET monitor configured to your liking, you’ve already lost valuable time you could have spent monitoring .NET applications.
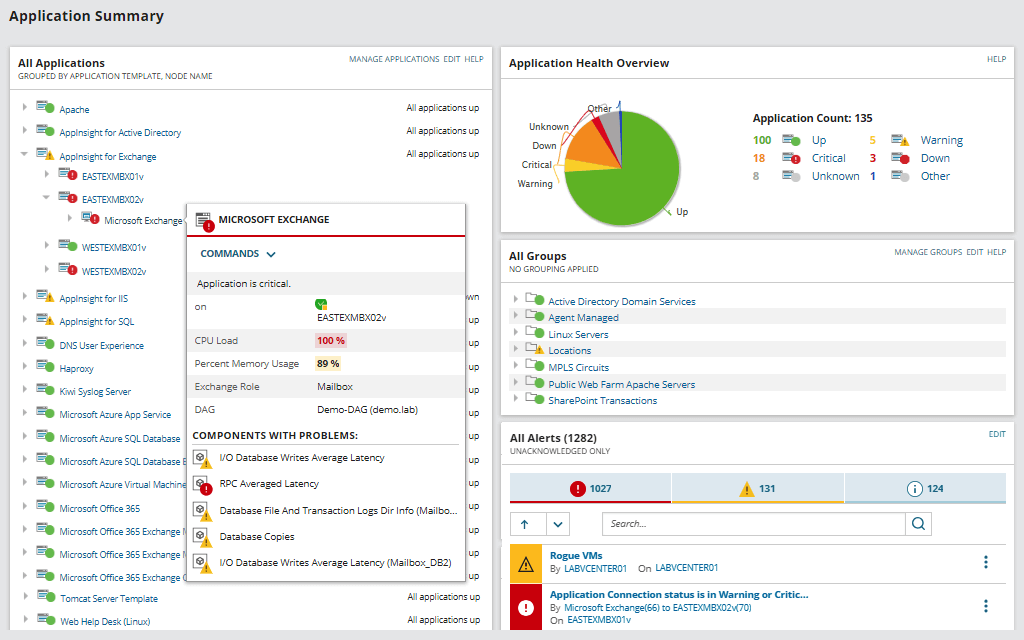
SolarWinds® Server & Application Monitor (SAM) is designed to monitor and manage .NET applications right out of the box. You can monitor heap size, threads, connections, and many other performance statistics to ensure high availability of your Microsoft .NET applications.
Server & Application Monitor features over a dozen metrics you can use to gain greater insight into the data pulled from your Microsoft .NET monitor. The powerful, intuitive dashboards included in SAM are built to help monitor .NET performance, availability, and usage statistics of your Microsoft .NET application servers and the business-critical applications running on them.
Key performance metrics available in SolarWinds SAM for .NET monitoring include:
Server & Application Monitor is designed so you can use historical trend reports to take context-aware action. Tune your Microsoft .NET applications to determine whether clusters should be load-balanced or if heap size should be adjusted based on transaction response times.
The automatically-generated graphs and reports can also be viewed on an hourly, daily, weekly, monthly, or custom-defined bases. You can generate different reports based on the resource type, like Application Server reports or Custom Application reports. Using SAM, you can quickly modify reporting for a department or recipient and automate report delivery using the Application Reporting Engine.
Microsoft .NET is a software and application development framework designed to offer its users many of the application-building capabilities they would get with Java but in a Windows-based systems environment. It’s free, open-source, and boasts many different application models. The platform is well-known for its vast library of coding languages, which can allow coders to pull from common functions used by other programmers instead of manually rewriting each line of code.
While this framework can make building applications easier and faster, it is often difficult to keep track of all your .NET applications in large, widely-distributed systems environments. However, monitoring .NET applications is important because these critical insights can be used to improve overall .NET application performance, such as helping more effectively allocate network resources and speed up troubleshooting.
.NET monitoring is the process of using a Microsoft .NET monitor tool to oversee the status and performance of an application in your systems environment. .NET performance monitoring solutions often use a variety of templates to monitor the health and performance of .NET applications or systems within your Windows operating environment.
For example, a Current Connections template can help show the total number of applications, devices, or users connected to the Web service at the current moment. This includes both authenticated and non-authenticated users. You can also adjust the thresholds within the template based on what your server can handle for greater accuracy. This template is excellent for monitoring usage, troubleshooting, and making more informed decisions about distributing network resources. If the Current Connections template tells you your Web service is at or near maximum capacity, you know you must use load-balancing or clustering technologies to ease the burden.
ASP.NET is a framework used to build web apps, APIs, and other services in .NET. ASP.NET extends .NET capabilities by offering more components specific to creating web applications. Like .NET, it’s free, open-source, and comes equipped with a built-in coding library
Here are five key tools, functions, or extensions ASP.NET adds to .NET:
ASP.NET health monitoring and general ASP.NET monitoring is critical for keeping your web-based applications running smoothly. Improving the performance of ASP.NET web applications begins with employing ASP.NET performance monitoring best practices. Here are some tips for improving and monitoring ASP.NET applications:
Since ASP.NET and .NET can be thought of as related tools, a Microsoft .NET monitor can be helpful for broad spectrum web server monitoring. However, to really drill down on issues, you will need to monitor metrics more specific to ASP.NET performance.
.NET monitoring software leverages a unified interface and monitoring templates to better streamline and automate the most challenging processes involved in .NET application performance monitoring. Tracking and improving the performance of .NET applications with monitoring software can help you answer these common questions:
Without .NET monitoring software, users may be required to individually locate and keep track of the performance for applications built with Microsoft .NET. In a widespread and diverse systems environment, this manual monitoring is often a time-consuming process that leads to more questions than it helps solve.
Server & Application Monitor is designed to offer dynamic server monitor capabilities right out of the box. Here are five SAM feature highlights built to help make .NET monitoring fast and simple:
With over 1,200 application monitoring templates contained within a single, intuitive web interface, users can easily monitor any application on any server anywhere at any time. SAM is built to manage applications running on on-premises, cloud, or hybrid systems environments from one unified tool. You can start troubleshooting and getting to the root of performance issues in as little as an hour.
Microsoft .NET is a software and application development framework designed to offer its users many of the application-building capabilities they would get with Java but in a Windows-based systems environment. It’s free, open-source, and boasts many different application models. The platform is well-known for its vast library of coding languages, which can allow coders to pull from common functions used by other programmers instead of manually rewriting each line of code.
While this framework can make building applications easier and faster, it is often difficult to keep track of all your .NET applications in large, widely-distributed systems environments. However, monitoring .NET applications is important because these critical insights can be used to improve overall .NET application performance, such as helping more effectively allocate network resources and speed up troubleshooting.
.NET monitoring is the process of using a Microsoft .NET monitor tool to oversee the status and performance of an application in your systems environment. .NET performance monitoring solutions often use a variety of templates to monitor the health and performance of .NET applications or systems within your Windows operating environment.
For example, a Current Connections template can help show the total number of applications, devices, or users connected to the Web service at the current moment. This includes both authenticated and non-authenticated users. You can also adjust the thresholds within the template based on what your server can handle for greater accuracy. This template is excellent for monitoring usage, troubleshooting, and making more informed decisions about distributing network resources. If the Current Connections template tells you your Web service is at or near maximum capacity, you know you must use load-balancing or clustering technologies to ease the burden.
ASP.NET is a framework used to build web apps, APIs, and other services in .NET. ASP.NET extends .NET capabilities by offering more components specific to creating web applications. Like .NET, it’s free, open-source, and comes equipped with a built-in coding library
Here are five key tools, functions, or extensions ASP.NET adds to .NET:
Server & Application Monitor
Use automatic discovery and server monitoring to speed up .NET performance monitoring.
Quickly monitor the performance and availability of Microsoft Azure and Amazon AWS services.
Use built-in templates to facilitate .NET application performance monitoring best practices.