- Events
-
Partners
- Government
- Customer Portal
- Contact Us
- Contact Sales
-
English
No matter the size of your network, you have log data coming from different sources and formats. Having log formats that vary from plain text to HTML can be difficult to analyze, especially when you’re trying to find a specific log among hundreds.
SolarWinds® Log Analyzer can help solve this problem with a log file viewer built to collect, normalize, consolidate, and help you analyze log data from SNMP traps, syslogs, Windows events, and VMware events. The tool can also allow you to filter and search through the data quicker to more easily perform root cause analysis.
SolarWinds Log Analyzer is designed to show you both historical and real-time data, depending on what you need. Log Analyzer offers a log stream of data as it’s produced by the systems and devices across your network to make it easier to monitor the logs as they come in and get the info you need for troubleshooting. With Log Analyzer, you can get the immediate insight you need to address problems before they seriously affect performance.
The ability to search through and visualize data effectively is the most important element of any log file viewer. SolarWinds Log Analyzer comes with a range of intuitive, out-of-the-box filters ready to help you start getting the insights you need from your log data. If you’re looking for a specific log, the tool’s powerful search engine can help you find the exact event you’re looking for. You can even add color-coded tags to your log data to help with filtering, searching, and identifying performance issues in the future, saving you time in the long run.
Sometimes you just need log data to solve a problem once. However, sometimes understanding log data is necessary for everything from informing help desk tickets, archiving information for historical reference, to simply sharing important performance data with your team members.
SolarWinds Log Analyzer is built to make it easier to filter, export, and save your log search results to a CSV file straight from the tool’s log viewer. Each exported record can include information including the time, date, node, severity level, IP address, source, and message.
Log Analyzer can be integrated with the SolarWinds Orion® Platform, meaning log data can be viewed alongside other SolarWinds solutions to create a single, comprehensive dashboard with metrics from across your infrastructure. By viewing log data alongside system and network performance metrics, you can gain fuller context to aid in troubleshooting for faster problem resolution.
Whether you’re using an application log file viewer, large log file viewer, or any other type of viewer, a log file viewer can help make log data easier to understand by parsing and organizing log files to be easier for you to find, analyze, and resolve issues when they occur.
By simplifying the log monitoring and management process, a log file viewer is a tool designed to make it easier to access and understand the log files constantly being created across your network and systems.
Log files are a form of automatically generated, time-stamped documentation of the events that occur within a system. Practically all systems and software applications generate logs, and logs come in a wide variety of forms, including audit logs, transaction logs, access logs, and more.
The purpose of log files is to create a detailed account of what’s happening behind the scenes, so if a problem occurs, you can access a detailed list of the events within your system surrounding the issue. Log data can help you drill down to the root cause and accelerate troubleshooting.
Of course, benefitting from logs can depend on your ability to make sense of the file. That’s where a log file viewer comes in. With a lot of logs being generated every minute, manually keeping track can be impossible. With a log file viewer, you can more easily organize and filter logs to only see the ones you need to help keep your network running optimally. By aggregating your logs in a single place and providing ways to search, filter, and view log data, a log file viewer can help you simplify and streamline log management and monitoring processes.
Viewing log file details is designed to be easier using a quality large log file viewer tool. By collecting log data from across your systems and devices into a single place, a log file viewer can help simplify finding and viewing the log files you need.
Log file viewers like SolarWinds Log Analyzer are built to consolidate data from multiple sources, including SNMP traps, syslog, Windows flat log files, Windows events, and VMware events. From there, the tools can make it easier to filter log data, so you can find the entries you’re looking for faster. Log file viewers can also include out-of-the-box filters to help you find the logs you need. Professional log file viewers may also come with powerful search engines to help you find the specific logs you want without needing to manually parse through unrelated data.
Once you have the log files you’re looking for, you can use the log viewer to see file details. Some tools even offer additional visualization tools to help you put individual logs in context, so you can better understand performance.
SolarWinds Log Analyzer is a log file viewer and log management solution designed to help you transform your network and system log data into actionable insights to help you improve performance.
In addition to collecting and aggregating logs to make them easier to view and understand, Log Analyzer includes analysis and management features for all-around log support.
When it comes to log file viewer capabilities, Log Analyzer comes with intuitive, out-of-the-box filters you can use to more easily get to the bottom of performance issues.
The tool is designed to let you search through logs with its powerful search engine while also letting you refine your log data, so you aren’t overwhelmed by the hundreds and thousands of log entries constantly coming in.
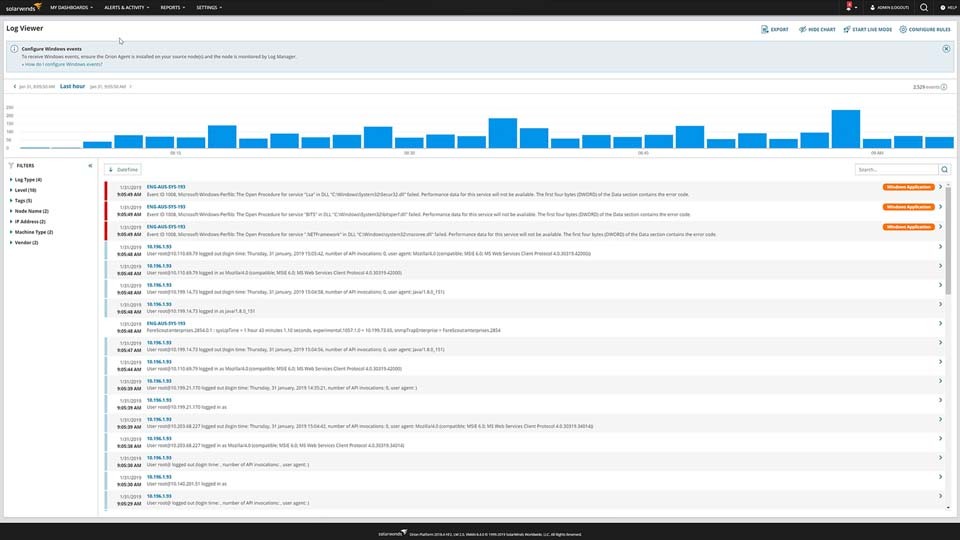
The log viewer software also comes with an interactive log stream view specifically designed to make it easier to visualize data. You can use the chart to search through filter results, visualize log volume, and even refine timeframes.
Key views to focus on when using the log file viewer software in SolarWinds Log Analyzer include:
Since Log Analyzer is integrated into the Orion Platform, you can also gain even more insight into your log data by viewing it alongside system and network performance metrics collected by other SolarWinds tools within the Orion Platform. You can even view the data side-by-side to see the physical and logical relationships between entities monitored by the Orion Platform. Unifying this data can help you dive even deeper into network and system performance by gaining greater context around your individual log entries, which can help you understand what additional factors may be affecting performance.
Whether you’re using an application log file viewer, large log file viewer, or any other type of viewer, a log file viewer can help make log data easier to understand by parsing and organizing log files to be easier for you to find, analyze, and resolve issues when they occur.
By simplifying the log monitoring and management process, a log file viewer is a tool designed to make it easier to access and understand the log files constantly being created across your network and systems.
Log files are a form of automatically generated, time-stamped documentation of the events that occur within a system. Practically all systems and software applications generate logs, and logs come in a wide variety of forms, including audit logs, transaction logs, access logs, and more.
The purpose of log files is to create a detailed account of what’s happening behind the scenes, so if a problem occurs, you can access a detailed list of the events within your system surrounding the issue. Log data can help you drill down to the root cause and accelerate troubleshooting.
Of course, benefitting from logs can depend on your ability to make sense of the file. That’s where a log file viewer comes in. With a lot of logs being generated every minute, manually keeping track can be impossible. With a log file viewer, you can more easily organize and filter logs to only see the ones you need to help keep your network running optimally. By aggregating your logs in a single place and providing ways to search, filter, and view log data, a log file viewer can help you simplify and streamline log management and monitoring processes.
Viewing log file details is designed to be easier using a quality large log file viewer tool. By collecting log data from across your systems and devices into a single place, a log file viewer can help simplify finding and viewing the log files you need.
Log file viewers like SolarWinds Log Analyzer are built to consolidate data from multiple sources, including SNMP traps, syslog, Windows flat log files, Windows events, and VMware events. From there, the tools can make it easier to filter log data, so you can find the entries you’re looking for faster. Log file viewers can also include out-of-the-box filters to help you find the logs you need. Professional log file viewers may also come with powerful search engines to help you find the specific logs you want without needing to manually parse through unrelated data.
Once you have the log files you’re looking for, you can use the log viewer to see file details. Some tools even offer additional visualization tools to help you put individual logs in context, so you can better understand performance.
SolarWinds Log Analyzer is a log file viewer and log management solution designed to help you transform your network and system log data into actionable insights to help you improve performance.
In addition to collecting and aggregating logs to make them easier to view and understand, Log Analyzer includes analysis and management features for all-around log support.
When it comes to log file viewer capabilities, Log Analyzer comes with intuitive, out-of-the-box filters you can use to more easily get to the bottom of performance issues.
The tool is designed to let you search through logs with its powerful search engine while also letting you refine your log data, so you aren’t overwhelmed by the hundreds and thousands of log entries constantly coming in.
The log viewer software also comes with an interactive log stream view specifically designed to make it easier to visualize data. You can use the chart to search through filter results, visualize log volume, and even refine timeframes.
Key views to focus on when using the log file viewer software in SolarWinds Log Analyzer include:
Since Log Analyzer is integrated into the Orion Platform, you can also gain even more insight into your log data by viewing it alongside system and network performance metrics collected by other SolarWinds tools within the Orion Platform. You can even view the data side-by-side to see the physical and logical relationships between entities monitored by the Orion Platform. Unifying this data can help you dive even deeper into network and system performance by gaining greater context around your individual log entries, which can help you understand what additional factors may be affecting performance.
Log Analyzer
Filter and search logs to get to the bottom of performance issues.
View logs using an interactive log stream.
Unify log data with performance and system metrics using the Orion Platform.