- Events
-
Partners
- Government
- Customer Portal
- Contact Us
- Contact Sales
-
English
Your infrastructure continuously generates log data to provide performance insights and monitoring this data in near-real time can give you the immediate insight you need to help with everything from troubleshooting to quickly responding to hardware issues. SolarWinds® Log Analyzer helps you monitor and perform log analysis before these issues impact your network performance with the help of real-time log normalization and visualization.
All log analysis software should give you the ability to search data effectively. SolarWinds Log Analyzer not only lets you search log data, but also filters monitored data using a powerful, built-in search engine. After collecting log data, you can refine the log files via intuitive, out-of-the-box filters included in Log Analyzer to help save you hours of manual work, so you can spend more time performing in-depth log analysis and less time searching.
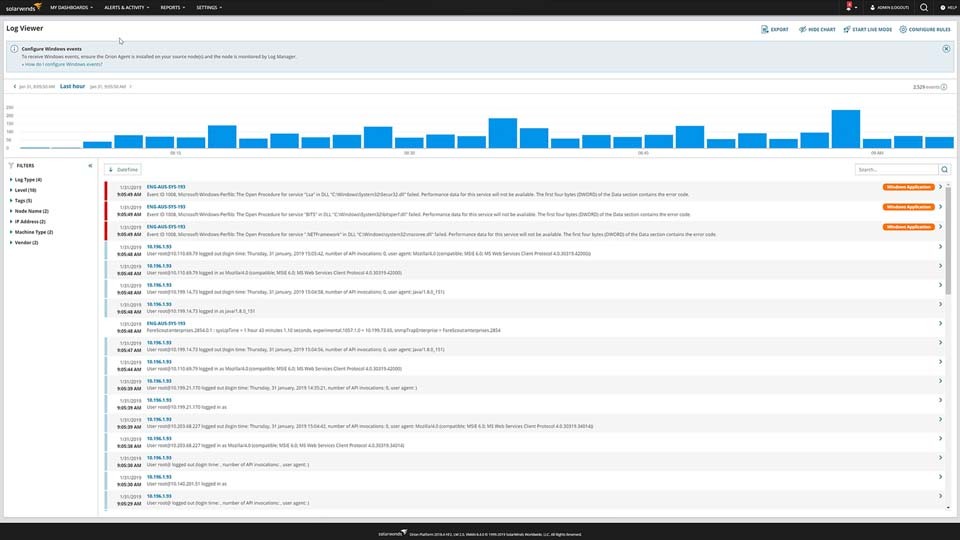
SolarWinds Log Analyzer is designed to help you quickly visualize log volume, search results, and refine timeframes via an interactive chart to more easily analyze log data and unify infrastructure performance.
Since Log Analyzer is integrated into the Orion® Platform, you can seamlessly plug your log data into the Orion Platform console to view it in a single dashboard. You can also view your data alongside other network and systems metrics, giving you a clearer view of network performance.
Log analysis is the process through which you can check your network data in the form of computer-generated log files. Log files are generated by devices and programs on your network, such as operating systems, network devices, and applications.
Whenever an event occurs in these devices or programs, a log can be automatically created to record details about the activity, including what occurred, when, and other important details. These logs can be viewed in real time or stored in log files to be reviewed later. Log analysis consists of reviewing log files to gain insights. Organizations and businesses may also be required to engage in log analysis as part of demonstrating compliance with regulations.
Effective log analysis can be improved with log analysis tools, which can help almost everything from problem diagnosis to improving security and performance. However, achieving those benefits can be challenging without the help of an event log analyzer tool. This is because the different devices and programs are often creating their own logs that cannot easily be compared to those being produced by other devices and programs. Log analysis tools help you correlate the data and make it correspond across the records from different devices, programs, and events. But event log analysis tools can also extract the data and find trends necessary for gaining insight into your network from the computer-generated log data. The best log analysis tools can create visual representations of log data from across your network to help you identify and troubleshoot possible issues faster.
The basic process of log analysis begins with collecting logs generated on your network. This may include reformatting logs into a single format, since most logs will be formatted differently as they’re produced by various applications and devices, run on different operating systems, and are from different vendors. When you reformat the logs in the same structure, you can more easily compare insights using the same data.
After you collect, parse, and restructure your logs, you then need to consider how your log data can be best viewed to support easier analysis.
Your infrastructure is constantly generating log data capable of giving you insight into system performance. However, because so much data is being produced all the time, it can be hard to find the data you need. While log analysis can be done manually, if you want to get to the bottom of performance issues faster, your best bet is to use a dedicated server log analyzer tool. A good solution provided by software vendors is a tool to assist with fast network detection and software configuration, such as the Discovery Wizard in SolarWinds Log Analyzer.
When you use quality log analysis tools like SolarWinds Log Analyzer, you can display your logs in a single centralized dashboard. From there, it’s much easier to search through the aggregated log files, correlate data from across the network, and even generate reports.
When you use a log analysis tool, these basic steps are performed automatically, so you can rest easier knowing you can quickly see and drill down into log when there’s an issue demanding attention.
When it comes to maintaining security and improving performance, completing effective log analysis is crucial. Log analysis can help you quickly identify performance and availability issues capable of otherwise leading to a slow network at risk for configuration errors. When you don’t engage in sufficient log analysis with the help of a server log analyzer solution, you also run the risk of falling behind on hardware health monitoring.
To ensure you maximize the benefits of log analysis while minimizing the time you need to spend gaining those insights, a log analysis tool can help you more easily parse through and correlate log data into a single structure. With an event log analyzer tool, you can increase network security, improve your awareness of any potential network infrastructure problems, increase the availability of applications, servers, and services, and help ensure regulatory compliance. Log analysis tools can also help you detect protocol failures and network outages more quickly, while also identifying failed services and processes faster.
When your logs are normalized and visually represented on a single dashboard with the help of a server log analyzer, you can spend your time on pressing issues. With manual log collection automated, you can focus your efforts on more easily detecting patterns displayed in the log data, flagging issues, and identifying areas for performance optimization. You can also use the data normalized by an event log analyzer to help demonstrate compliance and to understand and monitor user behavior.
SolarWinds Log Analyzer is a powerful log analysis tool designed to help with analyzing insights offered by log data without needing to endlessly monitor and normalize the logs yourself. The tool is designed to assist with collecting and analyzing traps, syslog, and VMWare and Windows events.
With SolarWinds server log analyzer features in Log Analyzer, you can:
Log Analyzer can be fully integrated with the SolarWinds Orion Platform, meaning you can combine insights from Log Analyzer with other SolarWinds tools to create a single, comprehensive solution for insights from across your environment in a centralized dashboard. Also included in the Orion Platform is an advanced alerting system to ensure you know when a performance or security issue arises, so you can begin troubleshooting and resolving the problem faster.
Log Analyzer®
Automatically normalize and correlate log data
See log data in real-time with an interactive chart and graph
Integrate with the Orion Platform for a centralized performance dashboard