- Events
-
Partners
- Government
- Customer Portal
- Contact Us
- Contact Sales
-
English
Your infrastructure continuously generates log data to provide performance insight. Being able to visualize and monitor syslog, SNMP traps, or Windows event logs in real-time helps give you the near-instantaneous insights you need for effective troubleshooting when problems arise.
SolarWinds Log Analyzer can help you collect, consolidate, analyze, and visualize log information within one tool, so you can uncover the root cause of problems faster. Log Analyzer is designed to provide the log visualization you need to keep your network and business up and running.
It doesn’t matter how big or small your network is, you are going to have log data coming in from different sources and in multiple formats. Often the log data is in HTML or plain text, which can be tricky to analyze—especially when you’re trying to find a single specific log among hundreds.
SolarWinds Log Analyzer is built to normalize logs into a single format that’s easier to search through as part of your troubleshooting.
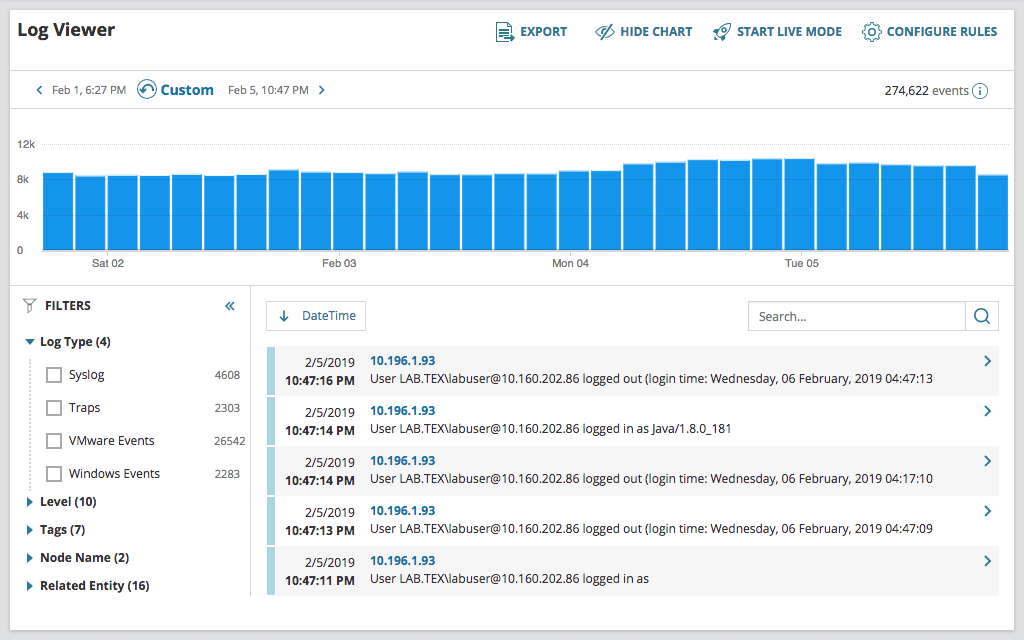
The best log visualization tools should not only provide users with the capability to collect log data, but also allow you to more effectively search, filter, and visualize data to gain insights. Apart from aggregating and collecting monitored log data, SolarWinds Log Analyzer is designed to let you refine and filter log files via intuitive, out-of-the-box filters. Using the powerful built-in search engine in Log Analyzer, you can quickly find the log entries you need, in a visual format to aid you in troubleshooting, saving you both time and effort.
Log visualization is the process of taking raw log data, which is often in HTML or plain text and difficult to understand, and displaying it in a visual format that makes it easier to understand and interpret. Log file visualization, like other forms of data visualization, typically involves displaying data in graphs, charts, bars, and other figures. By making it easier to see and understand the data, log visualization can make it easier for IT teams to detect patterns, identify trends, and generate statistics related to the log data for deeper analysis.
If you want to keep your network running optimally, you should use a log visualization tool. These tools are built to take the confusion out of your log file data, parsing and organizing your log files for you before putting them in a graph or chart, so you can find, analyze, and address issues as they arise.
For better understanding and access to useful system information, you may need to understand huge amounts of log files data. Without this understanding of log data, you may miss the information that makes the difference between great and poor system and network performance. This is where log visualization tools come in.
With log visualization tools, you can reduce the chances of missing key log data insights or troubleshooting opportunities. You can also improve your chances of detecting root causes behind performance problems, decreasing your mean-time-to-resolution and reducing the likelihood of network issues developing even further. Log visualization software can help save you both time and resources in the long run by helping you more easily ensure network performance remains optimal.
One of the best ways to make the most of your log file visualization is by using it as part of your real-time log analysis efforts. Without log visualization, important logs can get lost in the clutter of logs constantly being generated by your network and systems.
To use log visualization in real time, you need a tool to help you immediately visualize, prioritize, and monitor SNMP traps, syslog, and Windows event logs as they stream into the software. If you have a single tool to collect, consolidate, analyze, and visualize your log data, you can quickly check the real-time stream of log data when troubleshooting. In SolarWinds Log Analyzer, you can turn to the Live Feed feature to see an interactive log stream to see logs as soon as they come in.
SolarWinds Log Analyzer is a log file visualization and management solution designed to help you take your raw log data and turn it into actionable insights you can use to more easily troubleshoot problems and optimize network performance.
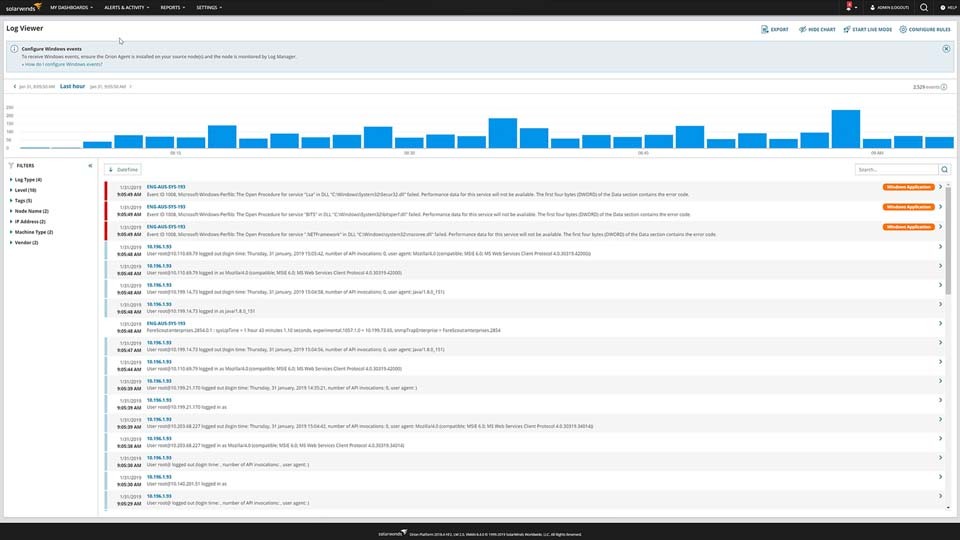
Log Analyzer is built to automatically collect, normalize, and consolidate your log data. Using Log Analyzer, you can more quickly visualize log data including log volume and adjust visualizations based on the tool’s many intuitive, out-of-the-box filters or your own search parameters. You can also refine timeframes via an interactive chart to help make it easier to identify the root cause of your performance problems. The tool also allows you visualize syslog and SNMP trap data as well as Apache logs from your infrastructure in real-time. Log Analyzer’s Live Feed features can let you do real-time analysis of logs as they are generated, so you’re not playing catchup with your log data.
By combining Log Analyzer with other SolarWinds products, you can integrate the network data you’ve monitored and collected with other tools directly into the Orion Platform console to view alongside log data, helping you understand your network performance even better.
Log visualization is the process of taking raw log data, which is often in HTML or plain text and difficult to understand, and displaying it in a visual format that makes it easier to understand and interpret. Log file visualization, like other forms of data visualization, typically involves displaying data in graphs, charts, bars, and other figures. By making it easier to see and understand the data, log visualization can make it easier for IT teams to detect patterns, identify trends, and generate statistics related to the log data for deeper analysis.
If you want to keep your network running optimally, you should use a log visualization tool. These tools are built to take the confusion out of your log file data, parsing and organizing your log files for you before putting them in a graph or chart, so you can find, analyze, and address issues as they arise.
For better understanding and access to useful system information, you may need to understand huge amounts of log files data. Without this understanding of log data, you may miss the information that makes the difference between great and poor system and network performance. This is where log visualization tools come in.
With log visualization tools, you can reduce the chances of missing key log data insights or troubleshooting opportunities. You can also improve your chances of detecting root causes behind performance problems, decreasing your mean-time-to-resolution and reducing the likelihood of network issues developing even further. Log visualization software can help save you both time and resources in the long run by helping you more easily ensure network performance remains optimal.
One of the best ways to make the most of your log file visualization is by using it as part of your real-time log analysis efforts. Without log visualization, important logs can get lost in the clutter of logs constantly being generated by your network and systems.
To use log visualization in real time, you need a tool to help you immediately visualize, prioritize, and monitor SNMP traps, syslog, and Windows event logs as they stream into the software. If you have a single tool to collect, consolidate, analyze, and visualize your log data, you can quickly check the real-time stream of log data when troubleshooting. In SolarWinds Log Analyzer, you can turn to the Live Feed feature to see an interactive log stream to see logs as soon as they come in.
SolarWinds Log Analyzer is a log file visualization and management solution designed to help you take your raw log data and turn it into actionable insights you can use to more easily troubleshoot problems and optimize network performance.
Log Analyzer is built to automatically collect, normalize, and consolidate your log data. Using Log Analyzer, you can more quickly visualize log data including log volume and adjust visualizations based on the tool’s many intuitive, out-of-the-box filters or your own search parameters. You can also refine timeframes via an interactive chart to help make it easier to identify the root cause of your performance problems. The tool also allows you visualize syslog and SNMP trap data as well as Apache logs from your infrastructure in real-time. Log Analyzer’s Live Feed features can let you do real-time analysis of logs as they are generated, so you’re not playing catchup with your log data.
By combining Log Analyzer with other SolarWinds products, you can integrate the network data you’ve monitored and collected with other tools directly into the Orion Platform console to view alongside log data, helping you understand your network performance even better.
Log Analyzer
See log data in real time with an interactive chart and graph
Use out-of-the-box filters to visualize the relevant log files
Perform real-time log analysis