- Events
-
Partners
- Government
- Customer Portal
- Contact Us
- Contact Sales
-
English
LA, an Orion module, is built on the SolarWinds Platform
Your infrastructure is constantly generating log data to provide performance insight. Collect, consolidate, and analyze thousands of syslog, traps, Windows, and VMware events to perform root-cause analysis with log monitoring tools from Log Analyzer.
Perform searches using basic matching. Execute searches using multiple search criteria and apply filters to narrow results. Save, schedule, and export search results within the log monitoring software.
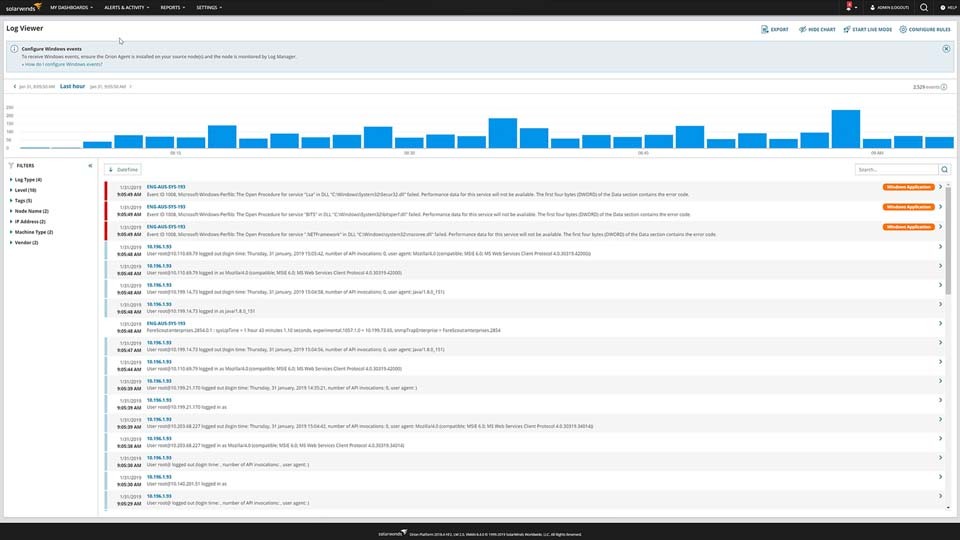
Traditional log collection and log management tools generate reports in plain text or HTML. SolarWinds® Log Analyzer displays logs in an interactive, real-time log stream.
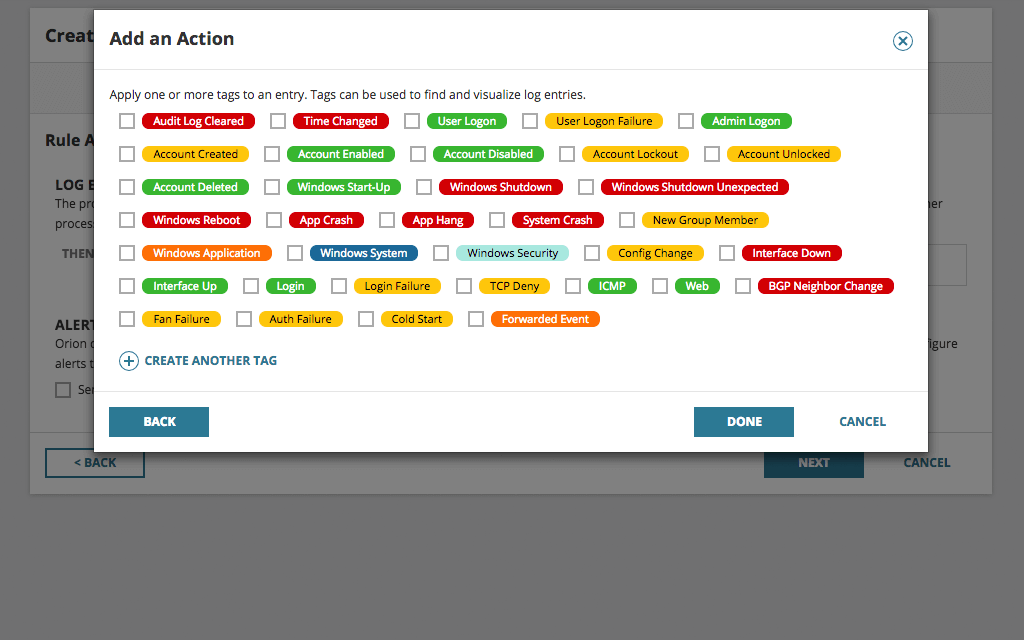
Easily apply (color-coded) tags to your log data to aid with filtering, searching, and identifying performance issues.
Log Analyzer can collect Windows flat log files and provide insight to help admins troubleshoot and resolve application issues faster.
SolarWinds Log Analyzer directly integrates your log and event data into the Orion Platform console so you can easily view log data alongside network and systems performance.
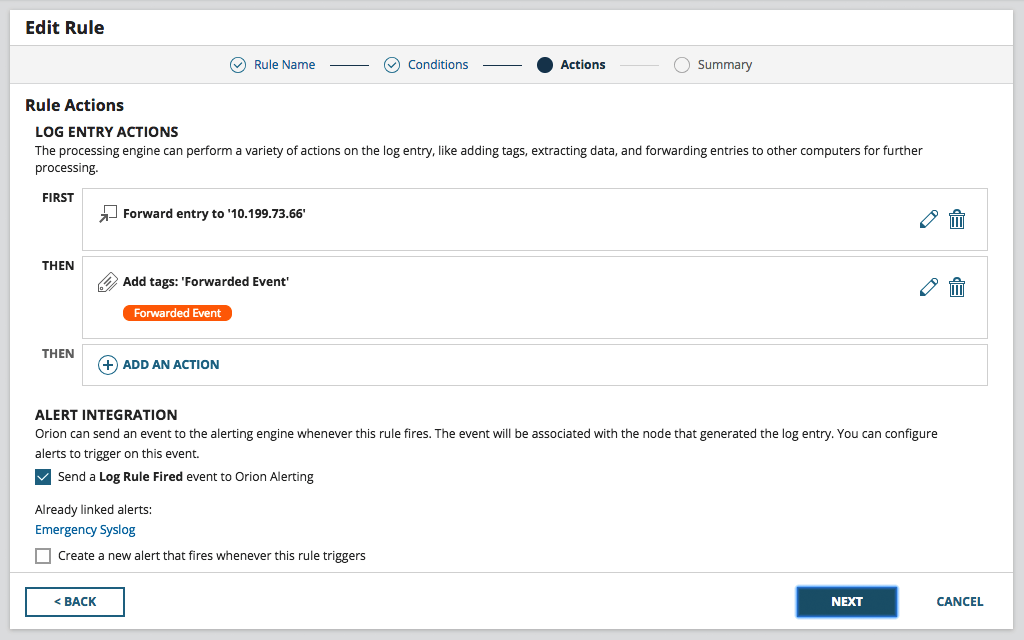
Be the first to know when issues arise. Log Analyzer integrates with the intelligent alert engine of Orion to provide customizable alerts along with delivery options including email notification, ServiceNow integration, and the triggering of an external script.
Having your log data in a central location is great for troubleshooting and correlation, but what if you need that useful data in other locations or tools? Log Analyzer allows you to forward logs to other applications, such as ticketing systems or SIEMs, and export log data to CSV files for even more flexibility.
Traditional log collection and log management tools generate reports in plain text or HTML. SolarWinds® Log Analyzer displays logs in an interactive, real-time log stream.
Log Analyzer can collect Windows flat log files and provide insight to help admins troubleshoot and resolve application issues faster.
SolarWinds Log Analyzer directly integrates your log and event data into the Orion Platform console so you can easily view log data alongside network and systems performance.
No need for complex volume calculations; the SolarWinds Log Analyzer software’s licensing is based on the number of devices generating log data, regardless of volume.
Syslog and SNMP Traps
The steps vary between vendors; however, simply configure your SolarWinds Orion server as your logging destination on your device.
Windows Events
To collect Windows events, simply deploy the Orion agent to the server you intend to collect logs from. For more information about deploying the Orion agent, read the following Knowledgebase Articles.
VMware Events
To collect VMware events, Log Analyzer users will need a paid license of SolarWinds Virtualization Manager (VMAN). There are two processes for collecting VMware events.
If setting up VMAN for the first time, simply add the VMware vCenter or Standalone ESXI host as a virtual device during setup. The entities will automatically register as a VMWare events source.
For existing VMAN users, simply upgrade to VMAN 8.4 with the VMware Events Add-on selected.
SolarWinds Log Analyzer currently supports syslog, SNMP traps, Windows flat log files, Windows events, and VMware events.
Data is stored in the SolarWinds Log Analyzer SQL database for seven days by default; however, this can be easily configured within the product settings.
Some features and capabilities of Log Analyzer are available for no additional cost when paired with a license of SolarWinds Network Performance Monitor or Server & Application Monitor.
| Features and Capabilities | Orion Log Viewer | Log Analyzer |
|---|---|---|
| Syslog Collection | ✓ | ✓ |
| Trap Collection | ✓ | ✓ |
| Windows Event Collection | ✓ | |
| VMware Event Collection | ✓* | ✓* |
| Keyword Searching | ✓ | ✓ |
| Filtering | ✓ | ✓ |
| Orion Alert Integration | ✓ | ✓ |
| Cross-stack Correlation via Perfstack™ | ✓ | ✓ |
| Log Forwarding | ✓ | ✓ |
| Log Tagging | ✓ | |
| Log Visualization | ✓ | |
| Real-time Log Streaming | ✓ | |
| Exporting to CSV | ✓ | |
| Log Viewer Access from Node Details Page | ✓ | |
| Events Per Second (EPS) | 1,000 | 1,000 |
| Date Retention | Up to One Year | Up to One Year |
✓* Requires a SolarWinds Virtualization Manager license
When your evaluation copy of Log Analyzer expires, it will revert to Orion Log Viewer for continued basic log monitoring capabilities.
Whether you are in IT ops, infrastructure, monitoring, or DevOps, SolarWinds has the right log monitoring and management tool for you.
Monitor critical log data in real-time to aid in troubleshooting
Your infrastructure continuously generates log data to provide performance insights, and monitoring logs in real-time can help give you the immediate insight you need. Whether it is syslog, SNMP traps, or monitoring Windows event logs, these log files can provide the critical pieces of insight you need to help with troubleshooting. Monitoring, collecting, consolidating, and analyzing log information using one tool can help you find root causes faster. SolarWinds Log Analyzer was designed to be the log management and analysis software you need to help keep your network and business up and running.
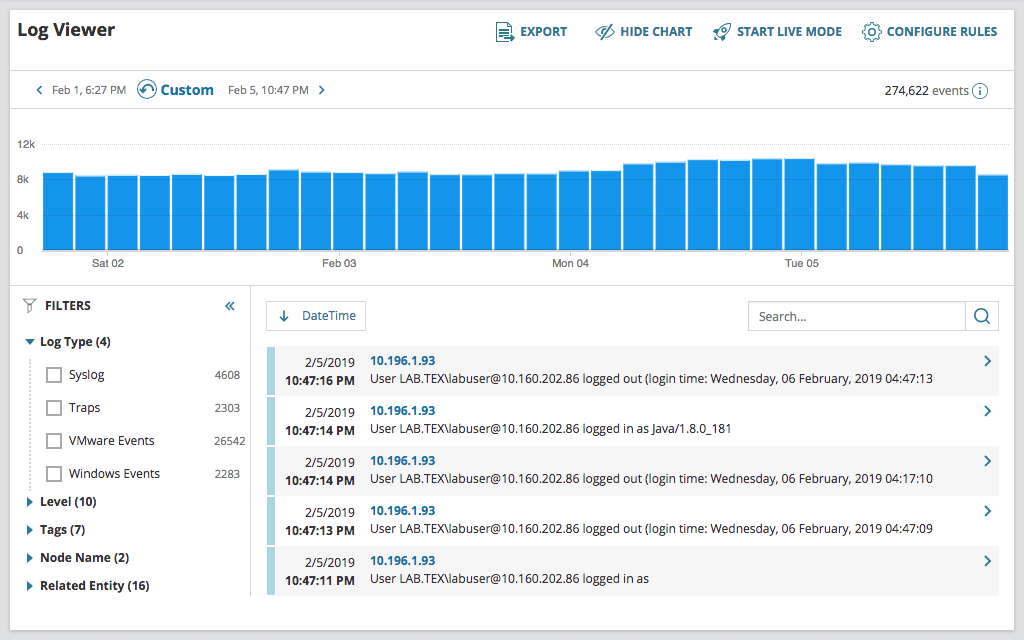
Filter your log data to find entries faster
Log Analyzer can help you easily filter your monitored log data. Once you collect the logs, you can refine them via intuitive, out-of-the-box filters. Using the powerful search engine built into Log Analyzer, you can quickly find the log entries of interest and save valuable time.
Visualize data via an interactive chart
Log Analyzer is designed to give you the capability to quickly visualize log volume, search results, and refine timeframes via an interactive chart. Since our log management software is integrated into the Orion Platform of products, you can seamlessly integrate the log data you’ve monitored and collected with Log Analyzer into the Orion Platform console, so you can view it alongside network and systems performance metrics. Unifying your log monitoring data and infrastructure performance can help give you a clearer view of your network’s performance.