- Events
-
Partners
- Government
- Customer Portal
- Contact Us
- Contact Sales
-
English
Routers, servers, switches, and other network elements generate numerous log files each day, and you need a way to leverage the logging information. That’s where SolarWinds® Kiwi Syslog® Server comes in. This tool is built to listen to network devices and collect logs into one dashboard where you can then easily search for signs of noteworthy incidents occurring across your network.
Kiwi Syslog Server offers a centralized syslog monitoring solution to help you pinpoint when issues began, identify crucial patterns, and drill down almost to the exact minute when your services started to fail.
In Kiwi Syslog Server, you can create, configure, and modify alarms from the File menu. Navigate to the Setup dialog box and select the Alarms node. From there, select the type of alarm you’d like to activate and input the appropriate threshold. Finally, select the preferred notification method for the alert (which can include an audible alarm, auto-running executable programs, or sending a notification by email).
Kiwi Syslog Server contains four primary alarms:
Kiwi Syslog Server offers a centralized platform for comprehensively organizing, monitoring, and managing your syslog data for your entire network. The application includes useful network troubleshooting tools and capabilities to help streamline the process.
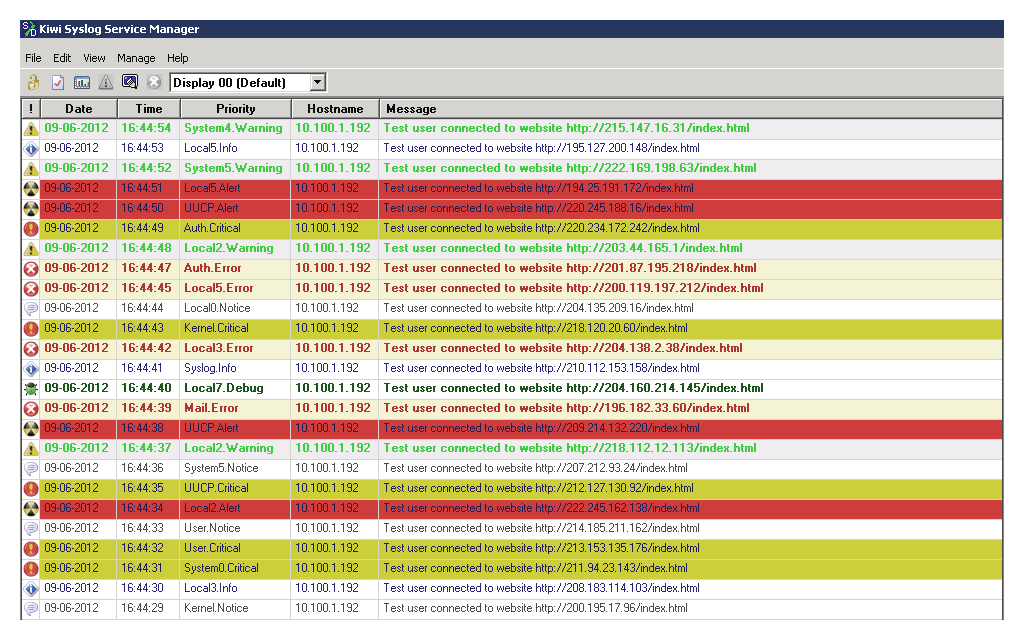
First and foremost, Kiwi Syslog Server collects syslog messages and SNMP traps from devices and Linux and Unix hosts across your entire network. Not only does Kiwi Syslog Server support syslog collection for an unlimited number of devices (including IPv4 and IPv6 devices), but it is also built to have capacity for up to two million inbound syslog messages per hour. While this may sound like a lot of log data to sort through when you’re troubleshooting, Kiwi Syslog Server’s intuitive web console makes it simple to search and filter through collected syslog messages. The centralized dashboard can display up to 25 different log views at once, making it possible to tailor your filtering criteria to the specifics of your troubleshooting investigation. What’s more, Kiwi Syslog Server can create graphs of various syslog statistics for improved at-a-glance comprehension and insight.
Kiwi Syslog Server also includes intelligent and customizable alert capabilities designed to keep you aware of performance issues and other potential problems worth looking into. When an alert is triggered, you’ll receive information about the alert type, kind of syslog message, message source, the time the alarm was triggered, and more.
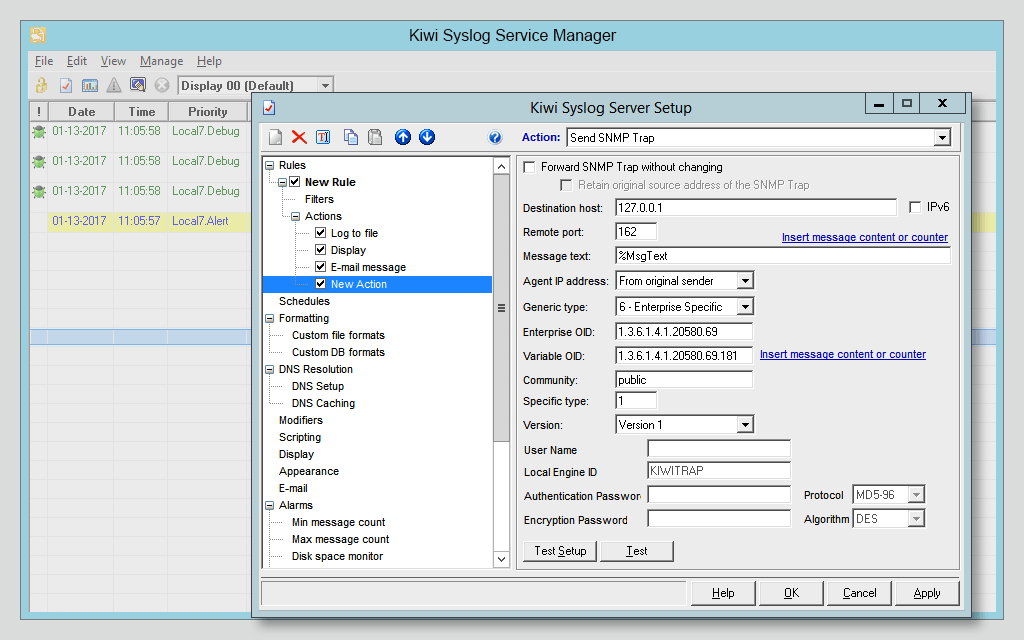
Kiwi Syslog Server is designed to streamline your troubleshooting efforts and includes several built-in actions allowing you to respond the moment the application detects something noteworthy in your system logs.
These built-in actions include the ability to send email notifications and reports, run executable scripts, launch external programs, and write logs to files, databases, or Windows event logs. Kiwi Syslog Server also lets you direct where logs are written to based on the source device, IP address, date, hostname, and other key variables. You can also forward your syslog messages and SNMP traps to different hosts, as well. This set of built-in actions gives you greater control over how your system logs are stored, organized, and managed, and allows deeper insights into your network operations.
SolarWinds Kiwi Syslog Server receives syslog messages and SNMP traps from your network hardware and devices, making it easier to identify when firewalls, switches, routers, and other business-critical elements are experiencing issues.
Kiwi Syslog Server’s network troubleshooting software features include numerous customization options, allowing you to set and modify rule-based actions to meet the specific needs and criteria of your network.
These rule-based actions, such as those mentioned above, make it possible to establish how Kiwi Syslog Server processes the messages and SNMP traps it receives. Each rule includes filters and follow-up actions you can modify to align with the requirements of your systems. Without filters in place, the rules will apply to all received syslog messages and SNMP traps—which can be useful in some network troubleshooting instances but may not be the most efficient course of action during all investigations.
Kiwi Syslog Server enables you to set rules to write syslog messages to specific files, send email notifications when the server detects urgent log messages requiring immediate attention, or run scripts on messages containing particular keywords. You can set and apply up to 100 rules in Kiwi Syslog Server, each of which can include up to 100 filters and 100 trigger actions.
This not only grants you granular controls over syslog monitoring and management, but also makes it possible to automatically archive your logs to assist you with compliance with industry standards and regulations. Kiwi Syslog Server can help you demonstrate compliance with SOX, PCI-DSS, FISMA, and other regulatory standards and includes a built-in scheduler for initiating automated archiving and clean-up processes. Furthermore, the scheduler can be used to automate some log management functions, as well, such as compressing, encrypting, transferring, and renaming syslog files.
In Kiwi Syslog Server, you can create, configure, and modify alarms from the File menu. Navigate to the Setup dialog box and select the Alarms node. From there, select the type of alarm you’d like to activate and input the appropriate threshold. Finally, select the preferred notification method for the alert (which can include an audible alarm, auto-running executable programs, or sending a notification by email).
Kiwi Syslog Server contains four primary alarms:
Kiwi Syslog Server offers a centralized platform for comprehensively organizing, monitoring, and managing your syslog data for your entire network. The application includes useful network troubleshooting tools and capabilities to help streamline the process.
First and foremost, Kiwi Syslog Server collects syslog messages and SNMP traps from devices and Linux and Unix hosts across your entire network. Not only does Kiwi Syslog Server support syslog collection for an unlimited number of devices (including IPv4 and IPv6 devices), but it is also built to have capacity for up to two million inbound syslog messages per hour. While this may sound like a lot of log data to sort through when you’re troubleshooting, Kiwi Syslog Server’s intuitive web console makes it simple to search and filter through collected syslog messages. The centralized dashboard can display up to 25 different log views at once, making it possible to tailor your filtering criteria to the specifics of your troubleshooting investigation. What’s more, Kiwi Syslog Server can create graphs of various syslog statistics for improved at-a-glance comprehension and insight.
Kiwi Syslog Server also includes intelligent and customizable alert capabilities designed to keep you aware of performance issues and other potential problems worth looking into. When an alert is triggered, you’ll receive information about the alert type, kind of syslog message, message source, the time the alarm was triggered, and more.
Kiwi Syslog Server is designed to streamline your troubleshooting efforts and includes several built-in actions allowing you to respond the moment the application detects something noteworthy in your system logs.
These built-in actions include the ability to send email notifications and reports, run executable scripts, launch external programs, and write logs to files, databases, or Windows event logs. Kiwi Syslog Server also lets you direct where logs are written to based on the source device, IP address, date, hostname, and other key variables. You can also forward your syslog messages and SNMP traps to different hosts, as well. This set of built-in actions gives you greater control over how your system logs are stored, organized, and managed, and allows deeper insights into your network operations.
SolarWinds Kiwi Syslog Server receives syslog messages and SNMP traps from your network hardware and devices, making it easier to identify when firewalls, switches, routers, and other business-critical elements are experiencing issues.
Kiwi Syslog Server’s network troubleshooting software features include numerous customization options, allowing you to set and modify rule-based actions to meet the specific needs and criteria of your network.
These rule-based actions, such as those mentioned above, make it possible to establish how Kiwi Syslog Server processes the messages and SNMP traps it receives. Each rule includes filters and follow-up actions you can modify to align with the requirements of your systems. Without filters in place, the rules will apply to all received syslog messages and SNMP traps—which can be useful in some network troubleshooting instances but may not be the most efficient course of action during all investigations.
Kiwi Syslog Server enables you to set rules to write syslog messages to specific files, send email notifications when the server detects urgent log messages requiring immediate attention, or run scripts on messages containing particular keywords. You can set and apply up to 100 rules in Kiwi Syslog Server, each of which can include up to 100 filters and 100 trigger actions.
This not only grants you granular controls over syslog monitoring and management, but also makes it possible to automatically archive your logs to assist you with compliance with industry standards and regulations. Kiwi Syslog Server can help you demonstrate compliance with SOX, PCI-DSS, FISMA, and other regulatory standards and includes a built-in scheduler for initiating automated archiving and clean-up processes. Furthermore, the scheduler can be used to automate some log management functions, as well, such as compressing, encrypting, transferring, and renaming syslog files.
Kiwi Syslog Server
Use syslog messages to diagnose network performance issues
Establish up to 100 rules with filters and contingency actions for rapid responses
Discover an affordable and effective network troubleshooting tool