- Events
-
Partners
- Government
- Customer Portal
- Contact Us
- Contact Sales
-
English
SolarWinds® Database Performance Monitor (DPM) is designed to continuously monitor database performance, providing insight into health and detailed performance metrics day-to-day, down to the second. DPM helps make database health checks simple with the help of flexible tools and expert guidance that can fill a critical gap in your monitoring stack, including the ability to provide instant recommendations on where to change server configuration or find queries with potentially bad behavior.
With 24/7 real-time monitoring, you can more easily attain your KPI goals for availability, deployment frequency, reduce deploy failures, lead time for changes, MTTD, MTTR, and more.
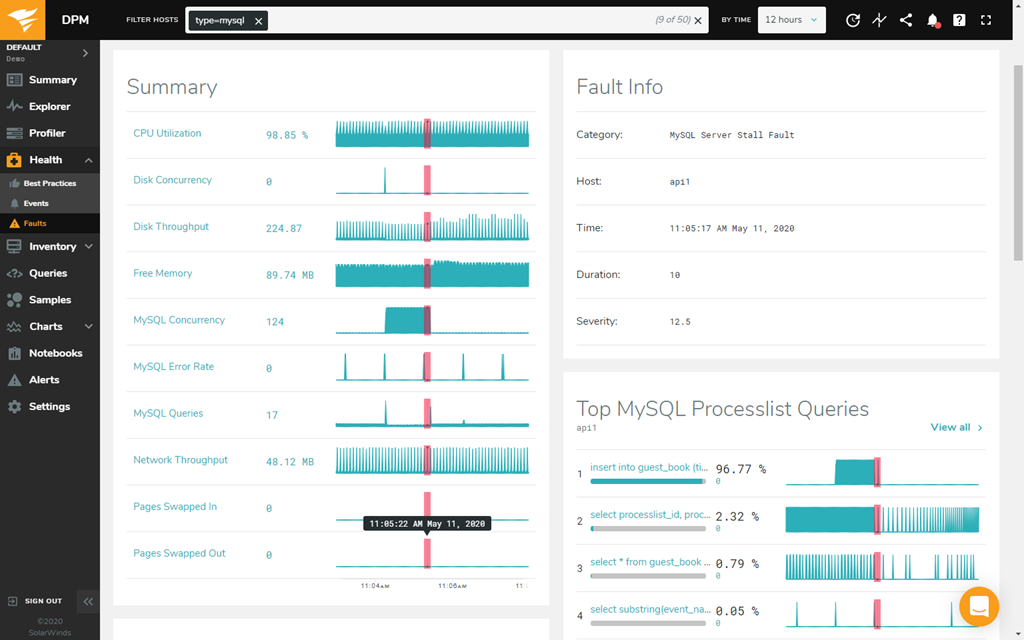
Traditional database monitoring can miss tiny interruptions to service or server availability that may potentially have a larger effect on database performance in the future. SolarWinds Database Performance Monitor is built to solve this problem with its patented Adaptive Fault Detection technology, which is designed to detect faults in the database server and storage subsystem to help you more easily investigate and resolve what’s causing the faults before they can lead to major outages.
Faults can be caused by poor performance or system overload. However, since the behavior of faults can seem unpredictable, they’re often harder to detect through threshold-based alerting and may not be located until they turn into major problems downtime. As faults get larger, they can also become more difficult to diagnose and resolve.
With DPM, you can more easily detect faults when they’re small and easier to diagnose and fix. When a fault happens, DPM is built to begin collecting more information and add the fault as an event on the Events page with an interface designed to help you more easily investigate and diagnose.
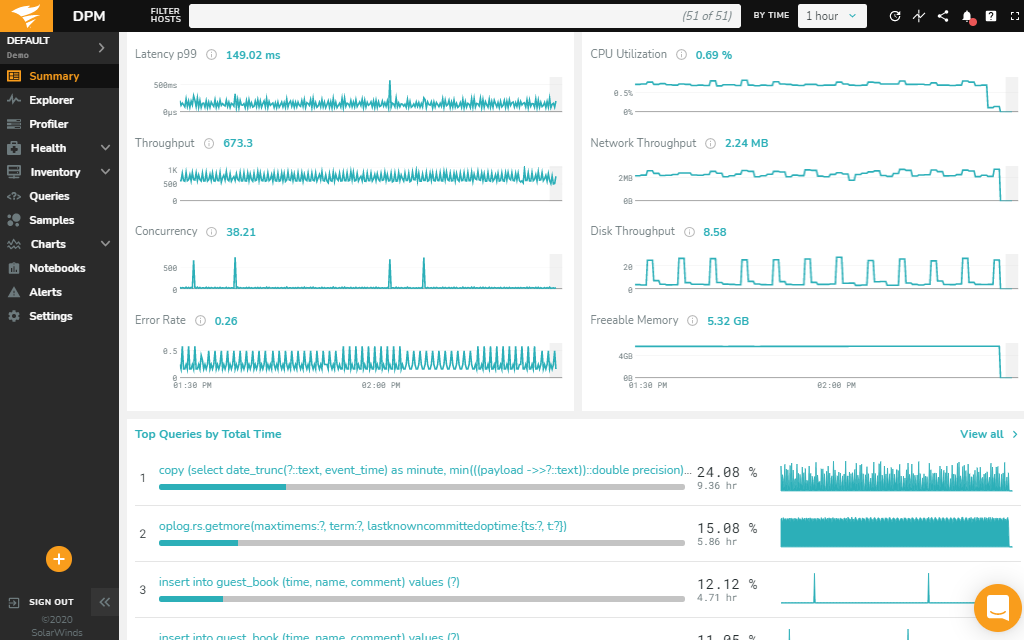
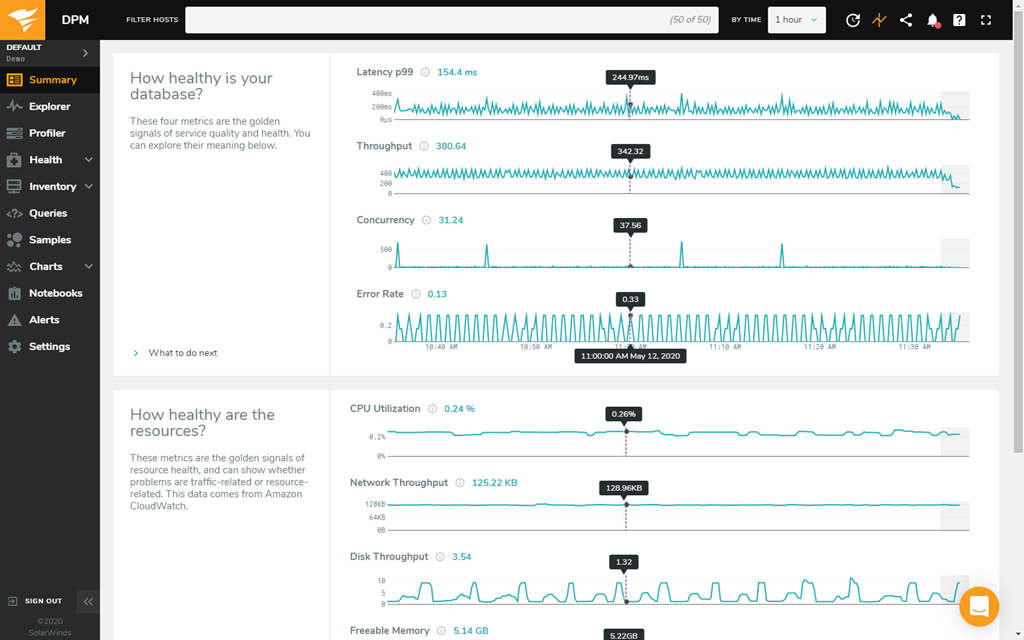
When it comes to real-time database health monitoring, having visibility into the key metrics you’re tracking is essential.
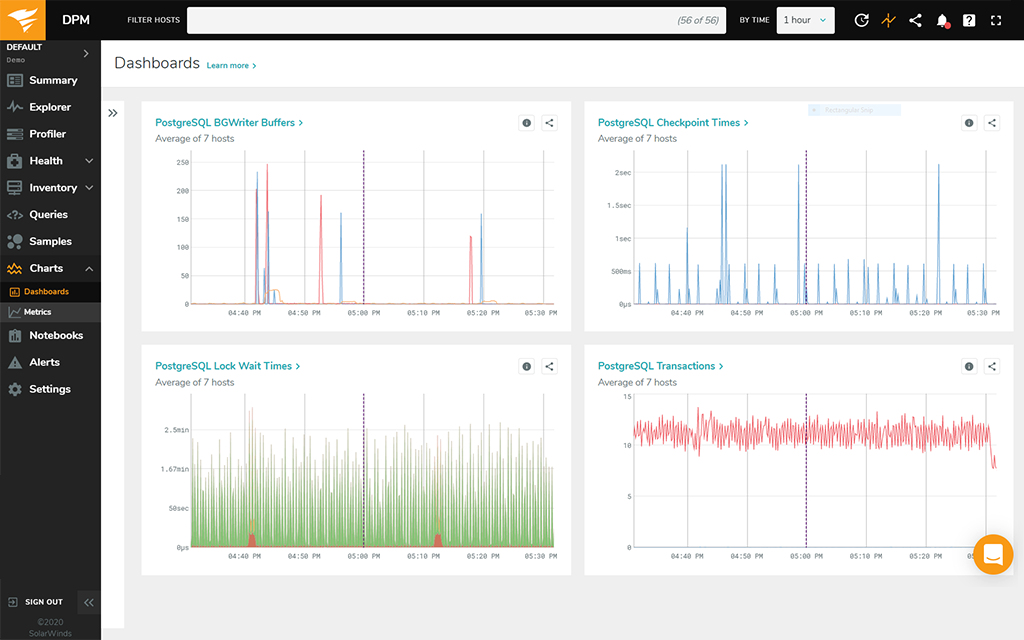
SolarWinds Database Performance Monitor is designed to continuously monitor key metrics tied to database health and allow you to build custom dashboards, so you can get insights into what’s important to you. With custom dashboards in DPM, you can:
Having a tool that performs thorough database health monitoring is important, but it’s even more valuable if it includes a powerful alerting system to help keep database administrators in the know about detected issues.
Database Performance Monitor includes a powerful, customizable alerting system to notify the appropriate stakeholders about inferred or detected abnormalities to the host, system, queries, and more before they have a chance to affect database availability or performance. Once alerted, DPM is built to be easier for database administrators to navigate and locate the information they need to begin addressing the problem with user-friendly dashboards.
SolarWinds Database Performance Monitor is a SaaS platform designed for database health monitoring for on-premises, hybrid, or cloud-based databases. DPM is built to deploy agents to pull data from a host to continuously monitor the function and performance of databases in real time.
DPM can be installed four ways:
A big part of checking database health is monitoring key metrics to better understand issues that could impact database health. Some of the most important server metrics related to database health to monitor include:
When it comes to understanding database health, it’s also important to consider which database type you’re using and picking the right health monitoring approach for that specific database. For example, a NoSQL database (which is not relational) may need a different database health check than a relational database like SQL.
Making a database available 24/7 depends on first knowing what contributes to database availability, so you can monitor key statistics and address issues before they can significantly affect availability.
A database is defined as being available if users of the data—including applications, customers, and employees—can readily access the data they need. Database availability can also be defined by the percentage of time the database can be used for productive work.
At least four main elements make up database availability:
Depending on the type of database you’re working with, there are a few different ways to make a database available 24/7. One of the best ways is to continuously monitor your database health, so you can more quickly identify and resolve issues that arise.
SolarWinds Database Performance Monitor (DPM) is a SaaS platform built to help you more easily maintain and improve the health of traditional, open-source, and cloud-native databases at scale and without overhead.
DPM is designed to continuously collect, display, and alert on essential database metrics that can indicate an issue with database health and performance. The tool can also display important database metrics in customizable views that can be easily shared to better enable cross-functional team workflows.
DPM features a fault detection algorithm built to detect when requests for work stall, so you can more easily detect and resolve what’s causing the faults to prevent interruptions to database availability and database health issues before they become outages.
Database Performance Monitor
Continuously track health of databases in the cloud, locally, and hybrid
More easily isolate environment changes after code deploys
Use real-time and historical data to quickly pinpoint database performance issues