- Events
-
Partners
- Government
- Customer Portal
- Contact Us
- Contact Sales
-
English
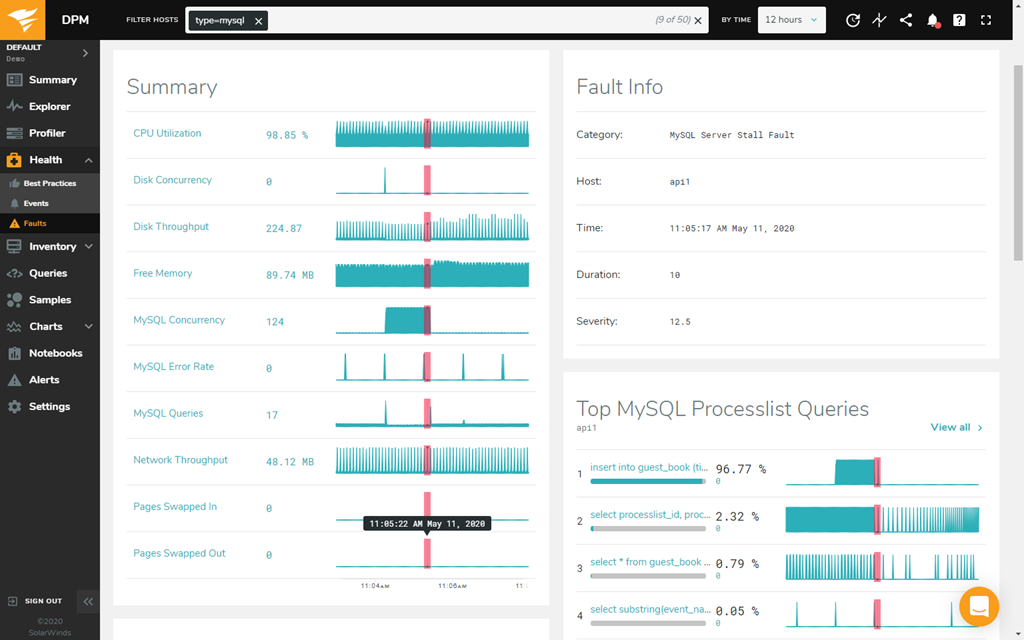
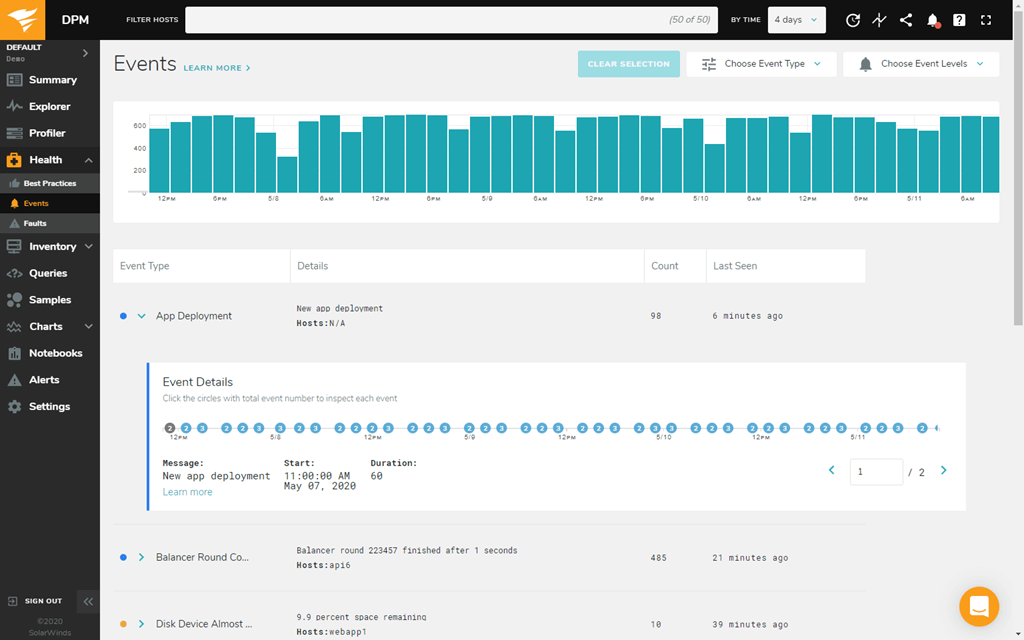
DPM is built with adaptive fault detection technology to allow you to detect small interruptions more easily in the server or service availability. A fault is best described as a brief stall, where requests like queries and I/O operations continue to arrive but aren’t serviced.
With adaptive fault detection, DPM is designed to display when a fault occurred in a timeline view with the ability to click into the fault to display further information about activity and status at that time. By quickly identifying faults, you can make proactive improvements, boost future performance, and better avoid serious outages.
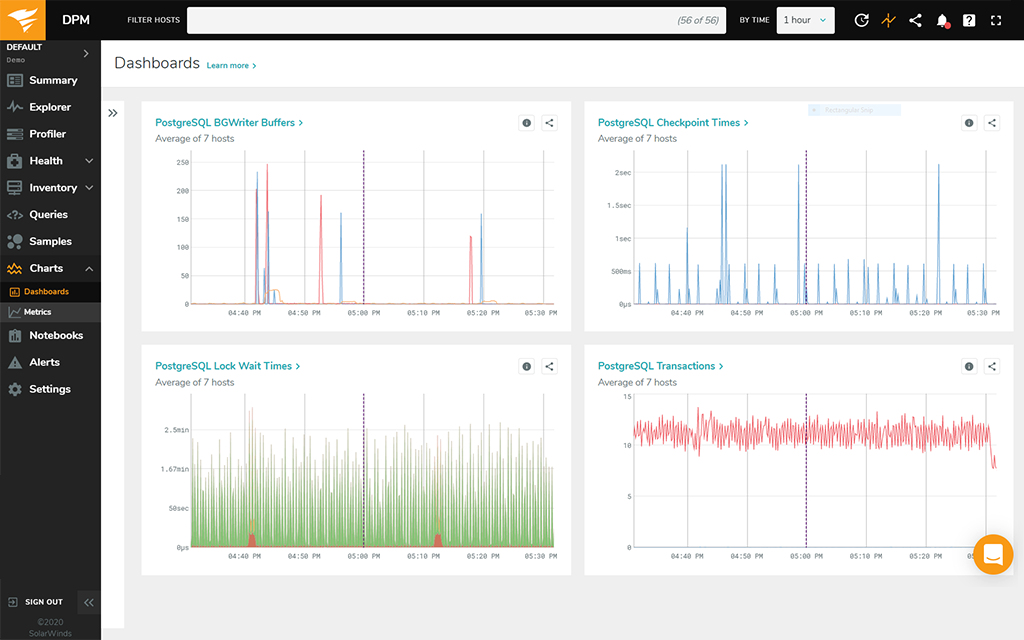
As a SaaS platform, DPM offers an intuitive web-based user interface to help you streamline your database management efforts.
DPM also allows several customization options to help make the database monitoring dashboard views work better for your purposes, such as the ability to simply create and share dashboard views that include only the metrics important to you.
A major advantage of a real-time database monitoring system is the ability to address database performance issues as soon as they arise. DPM allows you to establish custom thresholds for each of your database metrics, with alerts delivered straight to your inbox, Slack, VictorOps, and other messaging platforms.
In addition to threshold alerts, you can configure DPM to send event alerts to notify you when an unusual query or trend appears in your database metrics. With both threshold and event alerts, your team can more easily identify database issues faster.
Databases can store information for your enterprise and are often responsible for communicating data to your applications to service end users. Due to the key role databases play in your business operations, an efficient database can be crucial for application performance.
Database system tuning is the process of making changes to your database system to improve database performance. By monitoring database health and tuning system performance, you can more easily ensure streamlined database retrieval and help prevent bottlenecks.
In database system monitoring, controlling and reporting your database operations can be critical to successful application performance. Database monitoring software can allow you to keep track of server metrics in real time, so you can more quickly identify deficiencies in system resources and bottlenecks in your database sources.
A database monitoring system can help you make applications smoother by providing an adaptive approach to monitoring database system performance.
Database monitoring often requires understanding a comprehensive set of metrics by drilling down into the health and functionality of your databases in the cloud, locally, or hybrid. With performance indicators operating across OSI layers, database system monitoring tools can help you more easily optimize performance by collecting and reporting metrics from servers, virtual infrastructure, and databases in a centralized view. A database monitoring system is designed to provide optimization and tuning support to more easily allow you to improve performance to achieve uninterrupted data retrieval and a stronger end-user experience.
Database system monitoring tools can provide services to help you identify system inefficiencies that may lead to bottlenecks. Understanding infrastructure metrics like CPU utilization, memory, and disk space can allow you to identify impending resource shortages more easily before they affect the end-user experience. Similarly, client statistics and query data can help you detect unusual activity in your end-user communications that may contribute to downtime.
To perform database system performance monitoring effectively, your database system monitoring tools should collect relevant database metrics in real time.
To better control and report on bottlenecks to database system, monitoring tools can collect key metrics to help you better understand and proactively solve for potential performance issues. These metrics include:
Database system performance monitoring software like SolarWinds Database Performance Monitor can provide out-of-the-box dashboards to monitor multiple database systems, so you can configure the right metrics to track the performance of databases and identify potential bottlenecks in those systems.
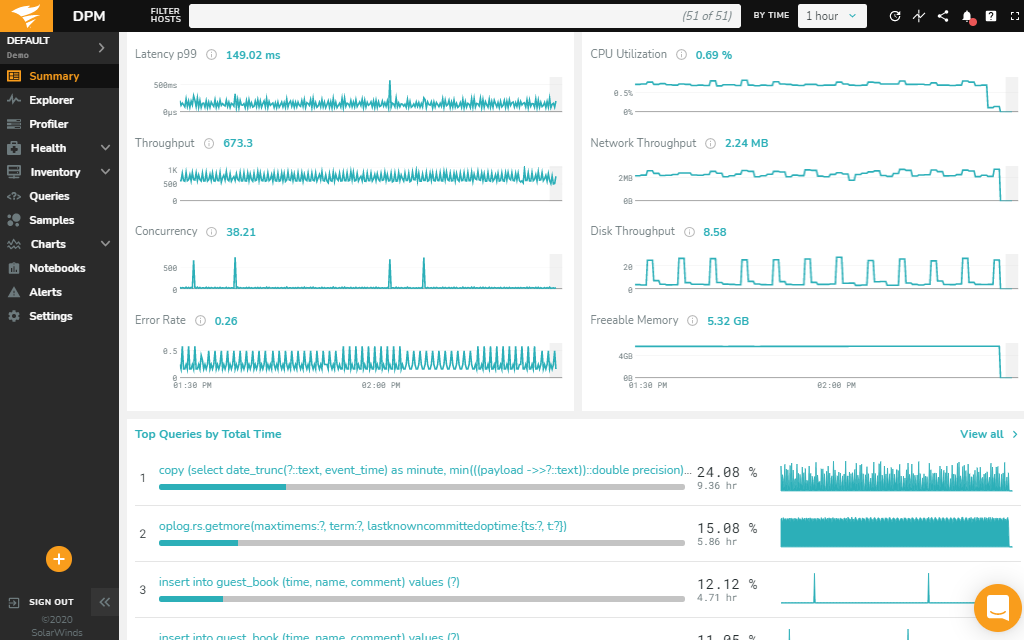
To identify the root cause of performance issues, SolarWinds Database Performance Monitor (DPM) allows you to view database health metrics in a unified dashboard, with graphical visualization of metrics over time. With real-time database monitoring using a web-based SaaS platform, DPM allows you to engage with database metrics more easily from a user-friendly control center.
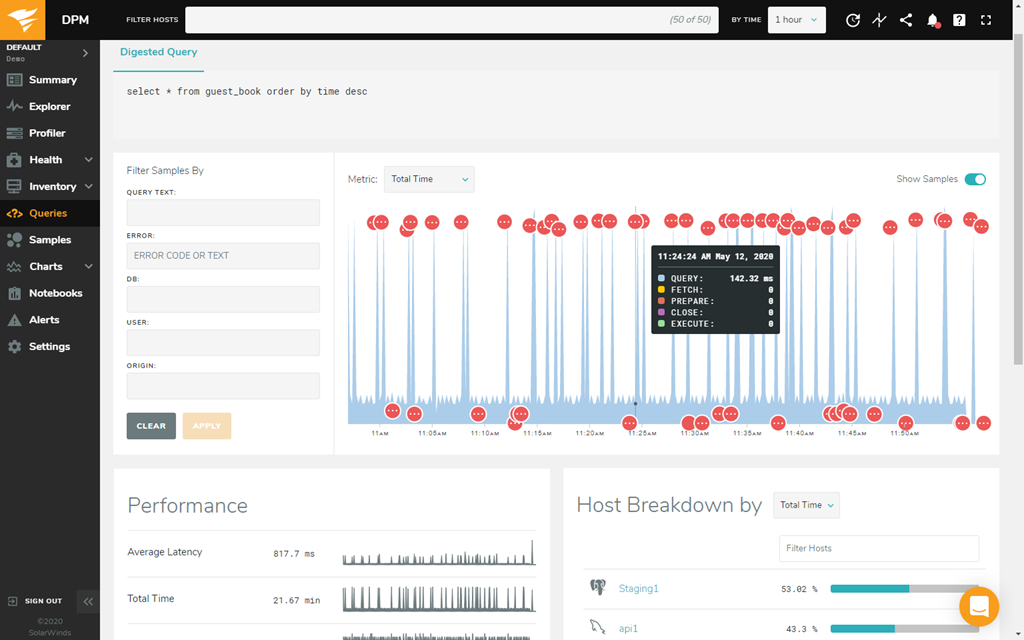
DPM provides dashboards for individual metrics and categories for an intuitive approach to database system performance monitoring. If you receive an alert about a database system issue, DPM’s graphical visualization can allow you to identify and troubleshoot bottlenecks by showing time-series graphs for each metric collected more easily.
With patented adaptive fault detection technology, DPM can identify minor disruptions in the database system and the location of the disruption on each graph. For a unified approach to adaptive fault detection, DPM is built to collect metrics from database systems like MongoDB, MySQL, PostgreSQL, Redis, and more.
To make your database monitoring system even more efficient, DPM is built to offer customizable alerts. DPM alerts are designed to be delivered in real time and triggered based on specific performance thresholds and unusual events you can configure to your needs.
Whether you’re supporting a large document-based MongoDB database or relational SQL database, system performance depends on database health. DPM is designed to help you identify and fix database issues quickly and easily by correlating query response or behavior to system performance metrics to better understand impact and pinpoint potential performance problems.
Databases can store information for your enterprise and are often responsible for communicating data to your applications to service end users. Due to the key role databases play in your business operations, an efficient database can be crucial for application performance.
Database system tuning is the process of making changes to your database system to improve database performance. By monitoring database health and tuning system performance, you can more easily ensure streamlined database retrieval and help prevent bottlenecks.
In database system monitoring, controlling and reporting your database operations can be critical to successful application performance. Database monitoring software can allow you to keep track of server metrics in real time, so you can more quickly identify deficiencies in system resources and bottlenecks in your database sources.
A database monitoring system can help you make applications smoother by providing an adaptive approach to monitoring database system performance.
Database monitoring often requires understanding a comprehensive set of metrics by drilling down into the health and functionality of your databases in the cloud, locally, or hybrid. With performance indicators operating across OSI layers, database system monitoring tools can help you more easily optimize performance by collecting and reporting metrics from servers, virtual infrastructure, and databases in a centralized view. A database monitoring system is designed to provide optimization and tuning support to more easily allow you to improve performance to achieve uninterrupted data retrieval and a stronger end-user experience.
Database system monitoring tools can provide services to help you identify system inefficiencies that may lead to bottlenecks. Understanding infrastructure metrics like CPU utilization, memory, and disk space can allow you to identify impending resource shortages more easily before they affect the end-user experience. Similarly, client statistics and query data can help you detect unusual activity in your end-user communications that may contribute to downtime.
To perform database system performance monitoring effectively, your database system monitoring tools should collect relevant database metrics in real time.
To better control and report on bottlenecks to database system, monitoring tools can collect key metrics to help you better understand and proactively solve for potential performance issues. These metrics include:
Database system performance monitoring software like SolarWinds Database Performance Monitor can provide out-of-the-box dashboards to monitor multiple database systems, so you can configure the right metrics to track the performance of databases and identify potential bottlenecks in those systems.
To identify the root cause of performance issues, SolarWinds Database Performance Monitor (DPM) allows you to view database health metrics in a unified dashboard, with graphical visualization of metrics over time. With real-time database monitoring using a web-based SaaS platform, DPM allows you to engage with database metrics more easily from a user-friendly control center.
DPM provides dashboards for individual metrics and categories for an intuitive approach to database system performance monitoring. If you receive an alert about a database system issue, DPM’s graphical visualization can allow you to identify and troubleshoot bottlenecks by showing time-series graphs for each metric collected more easily.
With patented adaptive fault detection technology, DPM can identify minor disruptions in the database system and the location of the disruption on each graph. For a unified approach to adaptive fault detection, DPM is built to collect metrics from database systems like MongoDB, MySQL, PostgreSQL, Redis, and more.
To make your database monitoring system even more efficient, DPM is built to offer customizable alerts. DPM alerts are designed to be delivered in real time and triggered based on specific performance thresholds and unusual events you can configure to your needs.
Whether you’re supporting a large document-based MongoDB database or relational SQL database, system performance depends on database health. DPM is designed to help you identify and fix database issues quickly and easily by correlating query response or behavior to system performance metrics to better understand impact and pinpoint potential performance problems.
Database Performance Monitor
Gain detailed insight into your database system with access to thousands of metrics
Prevent future bottlenecks and identify minor interruptions with adaptive fault detection technology
Address database system issues quickly and effectively using real-time alerts and analytics