- Events
-
Partners
- Government
- Customer Portal
- Contact Us
- Contact Sales
-
English
With automated profiling analysis, SolarWinds® Database Performance Monitor (DPM) can allow you to track performance metrics generated by complex databases like MongoDB. Automated profiling analysis is designed to provide a centralized view of latency, throughput, errors, and more across your MongoDB ecosystem in real time.
Using DPM, MongoDB performance issues can typically be resolved in minutes instead of spending hours analyzing query logs or manually executing and testing queries.
MongoDB optimization can be a complex process requiring a detailed understanding of your MongoDB environment and established best practices. DPM is built to help you check current configurations against best practices in your MongoDB operating system, database instances, and replica sets, so you can more easily identify inconsistencies based on official MongoDB documentation and find opportunities to improve database performance in operating areas like:
Expert advice about following best practices can help you more easily identify which metrics are important to track, evaluate performance, and troubleshoot issues unique to MongoDB more quickly. By enabling query samples, you can also have DPM send proactive alerts about possible query-writing and index optimizations to help you more easily improve database performance.
In addition to checking OS and database instances for settings inconsistent with established best practices, DPM can check if MongoDB security configurations follow best practices to help you more easily identify settings that can lead to potential vulnerabilities and provide ongoing compliance status updates.
MongoDB security checks in DPM can help you understand whether best practices were followed when configuring:
DPM is designed to help you quickly set up your MongoDB metrics monitoring, so you can start tracking and making improvements to database performance as soon as possible.
Once you install DPM, the Discovery feature is built to use agents to begin automatically retrieving data about queries, database, and infrastructure performance from MongoDB deployments and across your database environment using one-second resolution.
DPM is a SaaS-based solution with a web-based user interface built to provide MongoDB performance monitoring insights to help you more easily optimize the performance of your MongoDB database and minimize downtime.
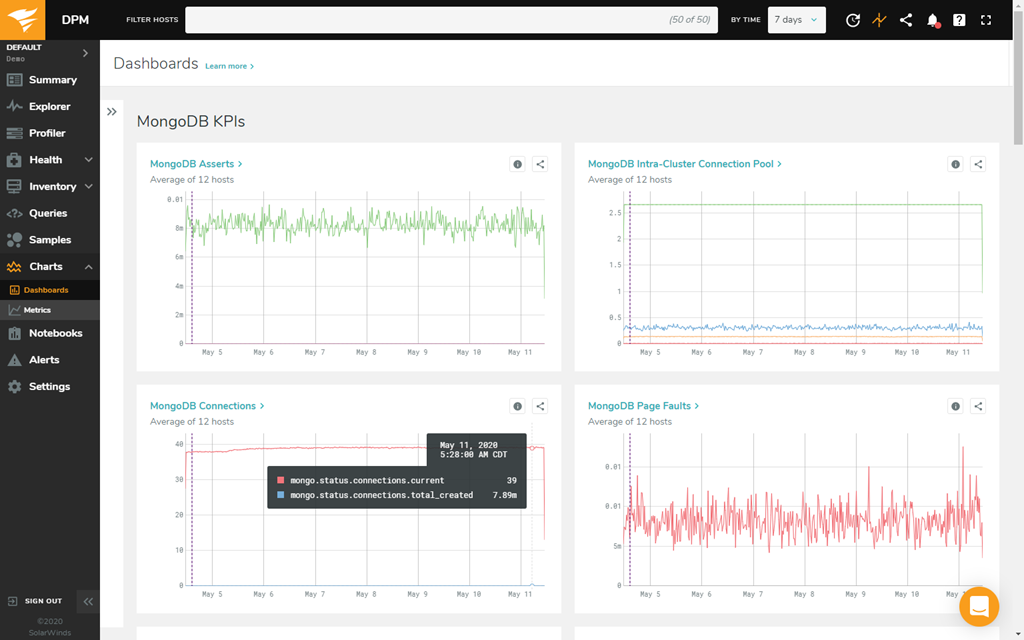
With customizable charts designed to be simple to create and share, DPM can also allow you to visualize the MongoDB performance data you care about. From a global performance view, you can also drill down into individual server metrics in typically just a few clicks.
MongoDB is a type of NoSQL database built to allow for large, flexible data storage and retrieval. With a cloud-based database infrastructure, MongoDB can be an effective platform for large organizations, serving the niche of a scalable database that can execute complex data retrieval and store large amounts of data.
Different enterprises require different database systems. Many businesses use a relational SQL database server, which can include database management systems like MySQL, PostgreSQL, or SQLite. SQL databases operate with a fixed schema of data, with data retrieval from static rows and columns within your database. SQL databases are commonly used database systems due to their ease of operation, and their efficiency in executing queries without a complicated retrieval process.
A NoSQL database system, like MongoDB, offers an alternative to SQL relational databases. NoSQL databases are often used by larger enterprises that require queries to retrieve data from multiple, complex data tables in a quick timeframe. The idea of NoSQL databases is to consolidate large amounts of data using a document-oriented approach.
Manually analyzing and troubleshooting database operations can be a time-consuming task. Using a MongoDB cloud monitoring solution can help you keep track of MongoDB metrics in a more organized, efficient way. Since MongoDB is designed for large and complex data storage and retrieval, MongoDB performance monitoring software is built to allow you to keep track of MongoDB metrics and understand analytics more easily.
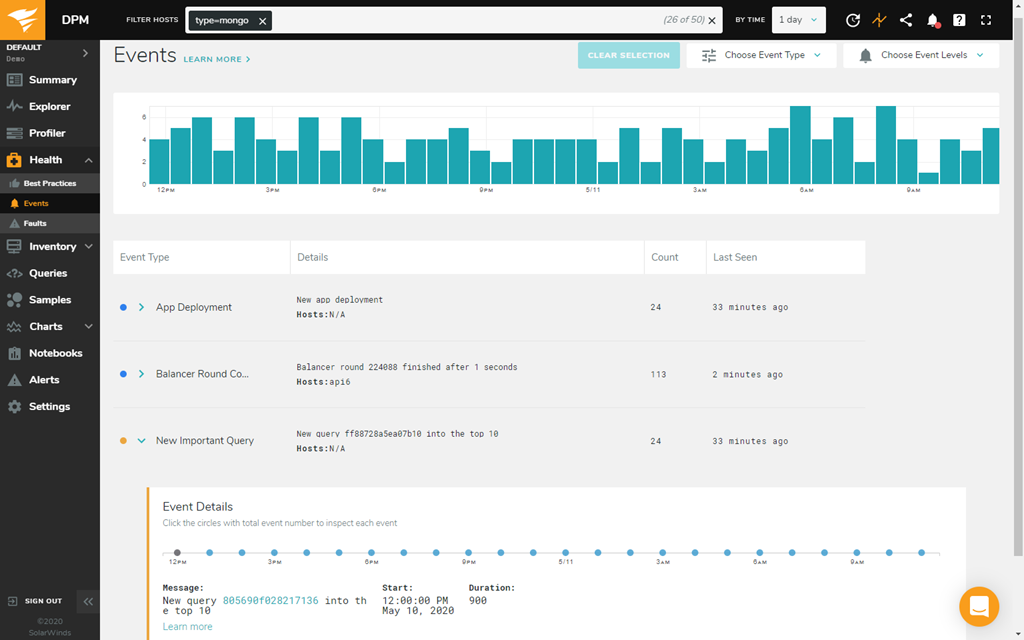
Once you configure your MongoDB performance monitoring tool, you can establish thresholds to identify unacceptable performance metrics more easily. If a metric breaches its threshold, a MongoDB monitoring tool can provide alerts in real time and help you identify performance issues as soon as they arise. To address bottlenecks quickly, performing regular MongoDB health checks using a monitoring solution can help you understand if there are existing or potential issues in your database. If the MongoDB health check identifies a value that exceeds an acceptable threshold, using a monitoring tool can help you more easily spot, assess, and troubleshoot MongoDB performance issues as quickly as possible with features like database analytics and graphical analysis.
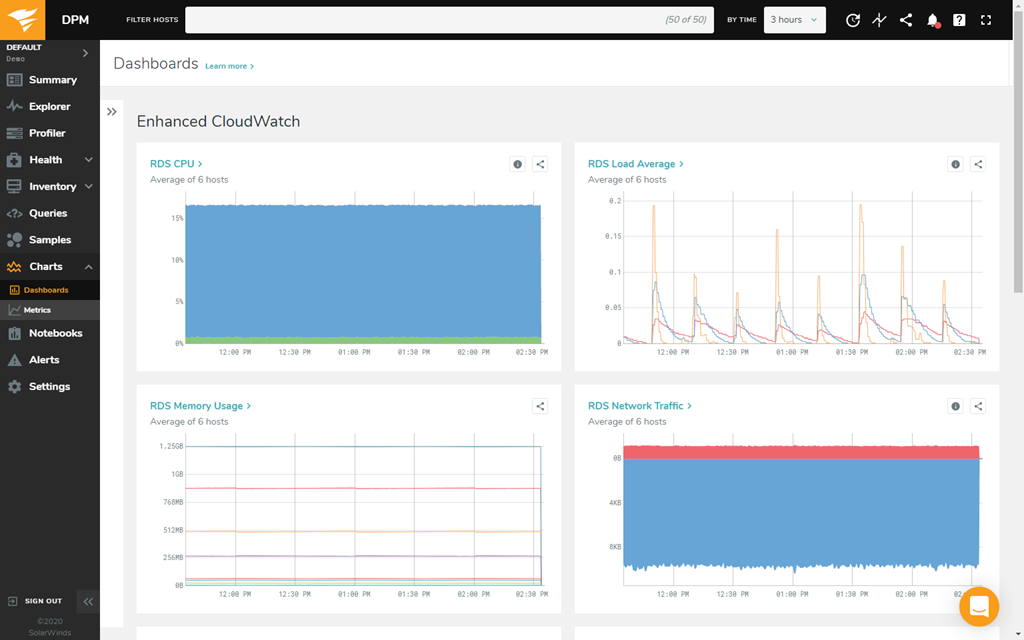
Your MongoDB database allows for cloud-based data storage and retrieval for large, complex operations. As a result of MongoDB’s complexity, MongoDB cloud monitoring tools can collect a diverse variety of performance metrics. From a centralized dashboard, your MongoDB monitoring software can organize these metrics into intuitive dashboards for ease of access.
Some of the most important metrics to track when monitoring MongoDB include:
Since MongoDB cloud monitoring can provide a bird’s-eye view of your expansive MongoDB server, your MongoDB monitoring tool should also provide a wide range of monitoring metrics. A user-friendly monitoring dashboard, complete with streamlined analytics, is the key to making MongoDB management manageable.
SolarWinds Database Performance Monitor (DPM) is built as a comprehensive MongoDB monitoring solution to help you minimize the amount of downtime caused by database bottlenecks. As a database monitoring tool, DPM aims to provide an intuitive user experience with a user-friendly interface.
With DPM, multiple team members can access from different devices using the web-based user interface to more easily control what views or actions a user can make. The DPM solution also includes the ability to configure role-based permissions to more easily control how and what users can view or interact with.
DPM is built to capture important MongoDB metrics using the vc-mongo-metrics plugin, including nearly all metrics provided by MongoDB commands serverStatus and several metrics from connPoolStats that can allow you to more easily track performance over time, troubleshoot issues, and identify improvement opportunities.
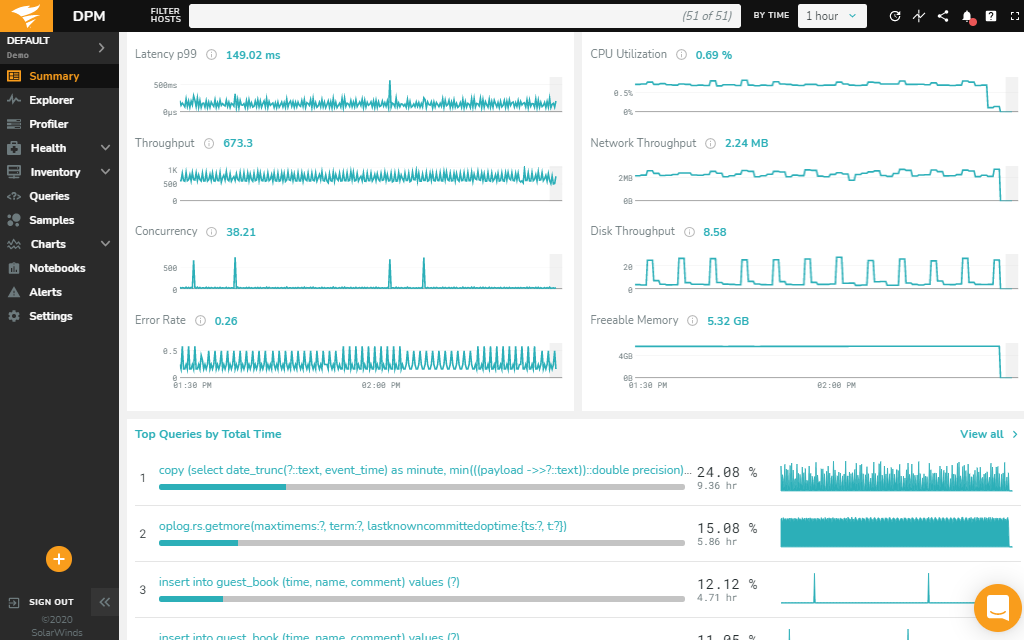
To help make sense of performance metrics, the MongoDB cloud monitoring tool in DPM is built with automatic profiling analysis to generate actionable summaries, with metrics separated into easy-to-understand categories. The query profiling software is designed to help you analyze both queries and structural database operations, so you can easily track important statistics for more effective MongoDB performance monitoring.
Automated profiling with DPM can also allow you to view metrics like latency, errors, and throughput. Instead of sifting through mountains of code to tune a slow query, automated profiling is designed to provide faster and more reliable analytics to help support your ability to perform quicker troubleshooting.
DPM is built to provide a variety of database monitoring tools for on-premises, cloud, and hybrid environments for traditional, open-source, and cloud-native database performance monitoring across multiple database platforms, including MongoDB.
MongoDB is a type of NoSQL database built to allow for large, flexible data storage and retrieval. With a cloud-based database infrastructure, MongoDB can be an effective platform for large organizations, serving the niche of a scalable database that can execute complex data retrieval and store large amounts of data.
Different enterprises require different database systems. Many businesses use a relational SQL database server, which can include database management systems like MySQL, PostgreSQL, or SQLite. SQL databases operate with a fixed schema of data, with data retrieval from static rows and columns within your database. SQL databases are commonly used database systems due to their ease of operation, and their efficiency in executing queries without a complicated retrieval process.
A NoSQL database system, like MongoDB, offers an alternative to SQL relational databases. NoSQL databases are often used by larger enterprises that require queries to retrieve data from multiple, complex data tables in a quick timeframe. The idea of NoSQL databases is to consolidate large amounts of data using a document-oriented approach.
Manually analyzing and troubleshooting database operations can be a time-consuming task. Using a MongoDB cloud monitoring solution can help you keep track of MongoDB metrics in a more organized, efficient way. Since MongoDB is designed for large and complex data storage and retrieval, MongoDB performance monitoring software is built to allow you to keep track of MongoDB metrics and understand analytics more easily.
Once you configure your MongoDB performance monitoring tool, you can establish thresholds to identify unacceptable performance metrics more easily. If a metric breaches its threshold, a MongoDB monitoring tool can provide alerts in real time and help you identify performance issues as soon as they arise. To address bottlenecks quickly, performing regular MongoDB health checks using a monitoring solution can help you understand if there are existing or potential issues in your database. If the MongoDB health check identifies a value that exceeds an acceptable threshold, using a monitoring tool can help you more easily spot, assess, and troubleshoot MongoDB performance issues as quickly as possible with features like database analytics and graphical analysis.
Your MongoDB database allows for cloud-based data storage and retrieval for large, complex operations. As a result of MongoDB’s complexity, MongoDB cloud monitoring tools can collect a diverse variety of performance metrics. From a centralized dashboard, your MongoDB monitoring software can organize these metrics into intuitive dashboards for ease of access.
Some of the most important metrics to track when monitoring MongoDB include:
Since MongoDB cloud monitoring can provide a bird’s-eye view of your expansive MongoDB server, your MongoDB monitoring tool should also provide a wide range of monitoring metrics. A user-friendly monitoring dashboard, complete with streamlined analytics, is the key to making MongoDB management manageable.
SolarWinds Database Performance Monitor (DPM) is built as a comprehensive MongoDB monitoring solution to help you minimize the amount of downtime caused by database bottlenecks. As a database monitoring tool, DPM aims to provide an intuitive user experience with a user-friendly interface.
With DPM, multiple team members can access from different devices using the web-based user interface to more easily control what views or actions a user can make. The DPM solution also includes the ability to configure role-based permissions to more easily control how and what users can view or interact with.
DPM is built to capture important MongoDB metrics using the vc-mongo-metrics plugin, including nearly all metrics provided by MongoDB commands serverStatus and several metrics from connPoolStats that can allow you to more easily track performance over time, troubleshoot issues, and identify improvement opportunities.
To help make sense of performance metrics, the MongoDB cloud monitoring tool in DPM is built with automatic profiling analysis to generate actionable summaries, with metrics separated into easy-to-understand categories. The query profiling software is designed to help you analyze both queries and structural database operations, so you can easily track important statistics for more effective MongoDB performance monitoring.
Automated profiling with DPM can also allow you to view metrics like latency, errors, and throughput. Instead of sifting through mountains of code to tune a slow query, automated profiling is designed to provide faster and more reliable analytics to help support your ability to perform quicker troubleshooting.
DPM is built to provide a variety of database monitoring tools for on-premises, cloud, and hybrid environments for traditional, open-source, and cloud-native database performance monitoring across multiple database platforms, including MongoDB.
Database Performance Monitor
SaaS platform with a web-based user interface
Get real-time performance metrics with automated profiling analysis
Check your configurations against MongoDB best practices