- Events
-
Partners
- Government
- Customer Portal
- Contact Us
- Contact Sales
-
English
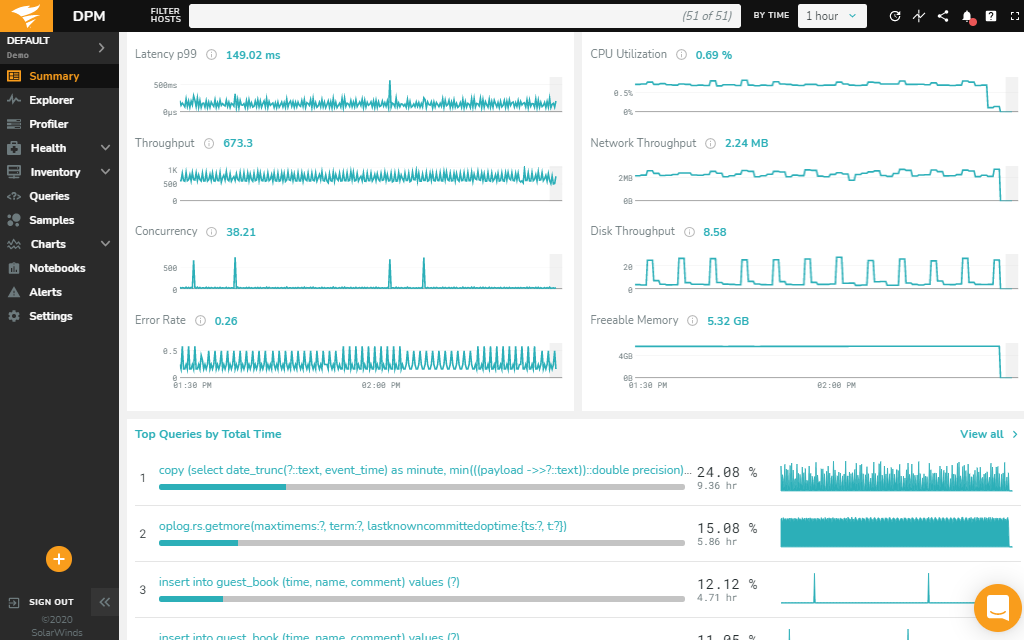
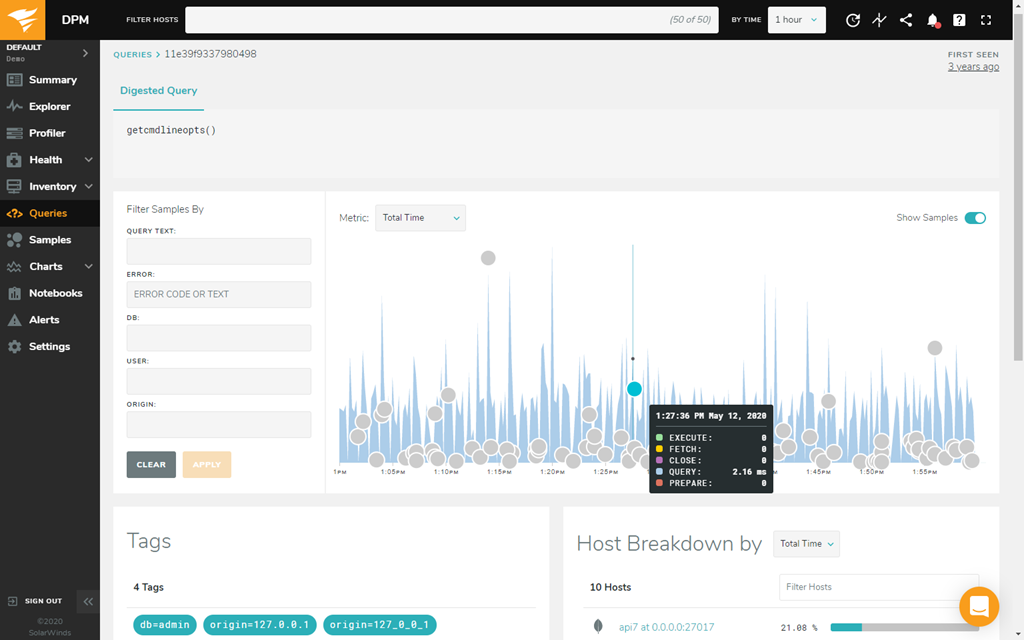
What do you do first when you notice a problem in your database? SolarWinds® Database Performance Monitor (DPM) gets answers fast by helping you uncover potential issues that might be connected to an error or outage. Down-to-the-second data collection can show you where you should start investigating to find the root cause, so your team can make changes, solve the current issue, and avoid future problems. Application development and DevOps teams can also use DPM to proactively prevent and minimize outages and achieve proven results.
To resolve potential issues before they turn into huge bottlenecks, you need to understand your database’s baselines. DPM is built to provide a unified view of database types, so you can get a bird’s-eye view of your systems. The easy-to-use dashboard helps you visualize thousands of collected metrics, track them, and watch for trends or performance outliers that may not match your database’s health summary. In addition, this database troubleshooting tool offers recommendations based on best practices, so you can more confidently and quickly take effective steps to optimize your database.
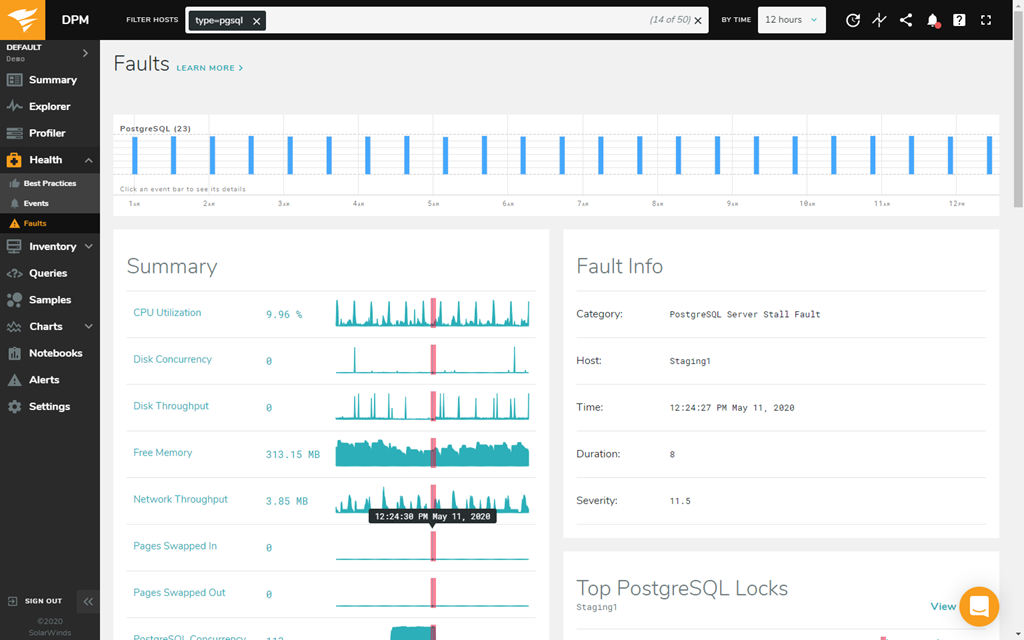
When database troubleshooting with DPM, you can dig deeper into potential issues by using the tool’s Adaptive Fault Protection feature. This feature is designed to help you find minor interruptions in server or service availability that might indicate a fault or cause serious outages later. In the DPM interface, faults are arranged from left to right in a timeline view. The height of the fault indicates severity and the width indicates duration. Click on any fault to find more information and drill down on root cause.
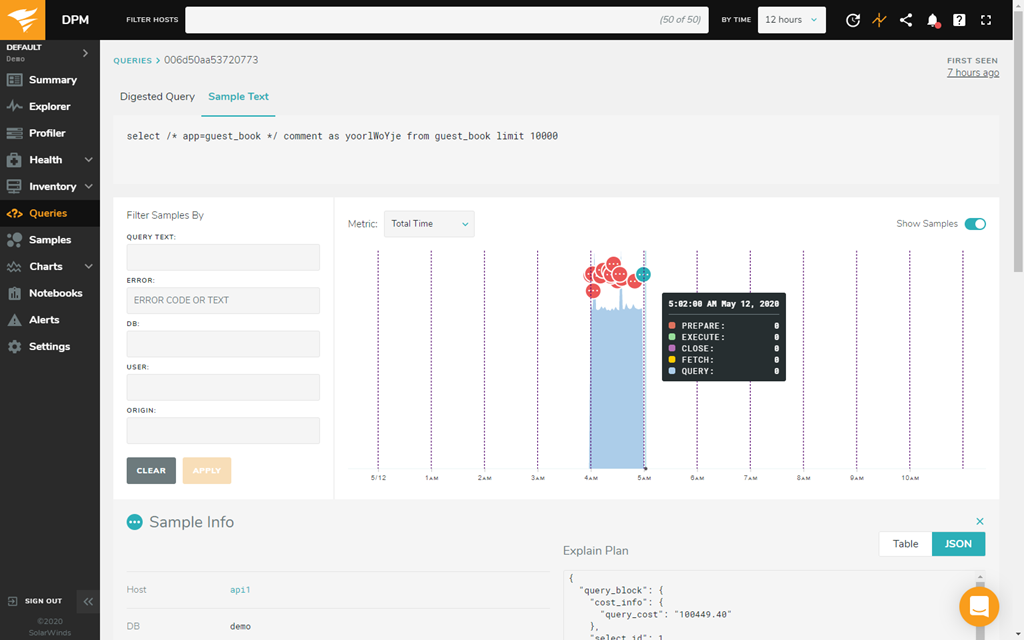
DPM also helps you and your team get better at database troubleshooting over time. You can create and share postmortem documentation across your team using DPM Notebooks with text, code snippets, links, and images. You can correlate query response or behavior to system metrics to better understand impacts, isolate unusual behavior and potential contributing factors within the database, and build a knowledge base, so when you’re troubleshooting similar database issues in the future, the process will be more streamlined.
Database troubleshooting requires precise and cyclical work to maintain performance at an optimal level. Database administrators often have to go through a lot of trial and error to figure out which database best practices work for their organization, and even then, they must continuously retool their databases to ensure everything is working as efficiently as possible.
When a database is slow, there are several common techniques you can follow as you first attempt to discover and fix the problem. When it comes to troubleshooting a slow database, five of the most common causes include:
Using a database troubleshooting tool like SolarWinds Database Performance Monitor can make identifying and resolving these issues simpler, faster, and easier.
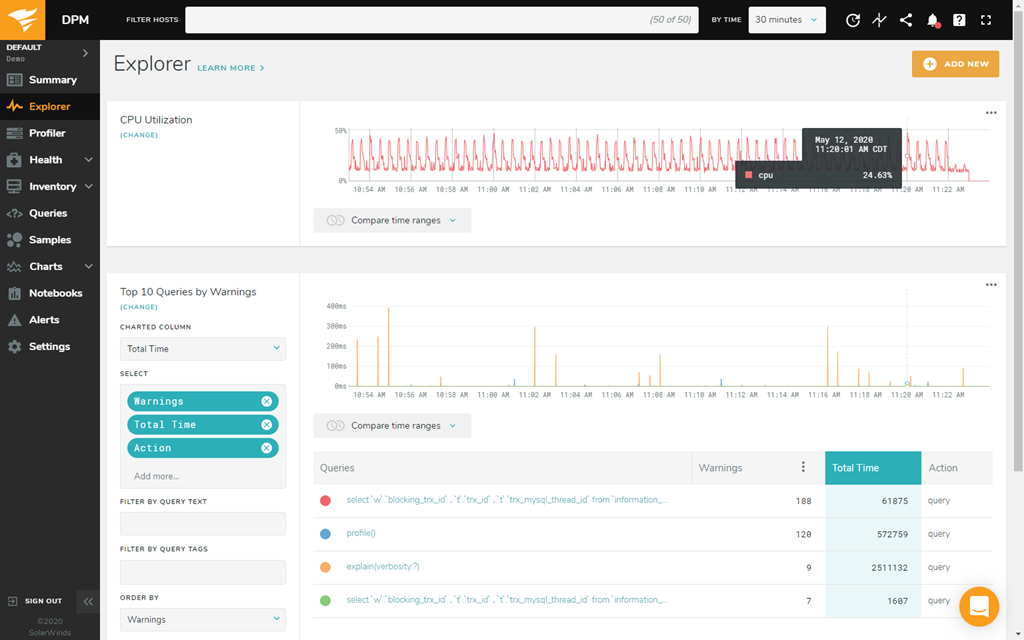
Database locking is a necessary but often troublesome part of database management. Whenever a user makes changes to a row of data in your table, SQL Server will lock the row, so nobody else can make more changes to the same data until the first data modification is complete. This helps protect shared project resources and data from constant, duplicative, or unnecessary changes, but database locks can easily become unwieldy and prevent multiple users from working on a database at the same time, which compromises efficiency.
To stop database blocking fast, you must stop the lead blocker. You can also use database troubleshooting tool to investigate which users or processes are locking your database and causing performance problems.
NoSQL databases are non-relational databases more akin to file folders than a traditional, table-centered database organized into rows and columns. These kinds of databases are good for organizing large or irregular collections of data, but they’re more time consuming to manage and take a lot more processing power.
SolarWinds Database Performance Monitor (DPM) is a database troubleshooting tool designed to help database administrators take control of open-source and cloud-native databases, including NoSQL databases like MongoDB. DPM features 24/7 health monitoring, real-time and historical analysis, and database performance analytics, which can be applied to NoSQL databases without compatibility issues.
Also, DPM automatically reviews your database instances and highlights settings inconsistent with a list of established best practices. These tests and checks are performed every 15 minutes and are built from documentation for each database technology. For example, if you use the popular NoSQL database MongoDB, DPM will run through a database server troubleshooting checklist specific to MongoDB OS, replication, and security configurations.
Database troubleshooting requires precise and cyclical work to maintain performance at an optimal level. Database administrators often have to go through a lot of trial and error to figure out which database best practices work for their organization, and even then, they must continuously retool their databases to ensure everything is working as efficiently as possible.
When a database is slow, there are several common techniques you can follow as you first attempt to discover and fix the problem. When it comes to troubleshooting a slow database, five of the most common causes include:
Using a database troubleshooting tool like SolarWinds Database Performance Monitor can make identifying and resolving these issues simpler, faster, and easier.
Database locking is a necessary but often troublesome part of database management. Whenever a user makes changes to a row of data in your table, SQL Server will lock the row, so nobody else can make more changes to the same data until the first data modification is complete. This helps protect shared project resources and data from constant, duplicative, or unnecessary changes, but database locks can easily become unwieldy and prevent multiple users from working on a database at the same time, which compromises efficiency.
To stop database blocking fast, you must stop the lead blocker. You can also use database troubleshooting tool to investigate which users or processes are locking your database and causing performance problems.
NoSQL databases are non-relational databases more akin to file folders than a traditional, table-centered database organized into rows and columns. These kinds of databases are good for organizing large or irregular collections of data, but they’re more time consuming to manage and take a lot more processing power.
SolarWinds Database Performance Monitor (DPM) is a database troubleshooting tool designed to help database administrators take control of open-source and cloud-native databases, including NoSQL databases like MongoDB. DPM features 24/7 health monitoring, real-time and historical analysis, and database performance analytics, which can be applied to NoSQL databases without compatibility issues.
Also, DPM automatically reviews your database instances and highlights settings inconsistent with a list of established best practices. These tests and checks are performed every 15 minutes and are built from documentation for each database technology. For example, if you use the popular NoSQL database MongoDB, DPM will run through a database server troubleshooting checklist specific to MongoDB OS, replication, and security configurations.
Database Performance Monitor
Diagnose issues from a lightweight SaaS platform with a web-based user interface.
Easily monitor on-premises, cloud, hybrid, and open-source databases.
Use real-time and historical data to pinpoint performance issues and troubleshoot quickly.