- Events
-
Partners
- Government
- Customer Portal
- Contact Us
- Contact Sales
-
English
Network performance reporting is an essential step in network performance monitoring. While network performance monitoring provides real-time performance data for ongoing visibility, network reporting allows you to synthesize specific information in an easily digestible and shareable format.
Network performance reporting can be used and shared internally to gain important, actionable insights. With the help of a network performance report, you can quickly make informed decisions based on both current and historical data and metrics. By examining network reports and viewing capacity usage trends, you may be able to forecast, detect, diagnose, and resolve network issues before outages occur. You can better understand your organization's resource utilization trends and feel confident making decisions around optimizing your IT infrastructure and planning upgrades.
Network performance reporting is also critical for proving compliance with service-level agreements. Many organizations need to ensure they are meeting service-level agreements and quality of service standards, and reports provide a way to gather and view the relevant information. With customizable reports, it’s possible to easily pull and share the right information with specific departments or recipients.
A network monitoring report can include a range of network data that provides insight into performance, availability, and more.
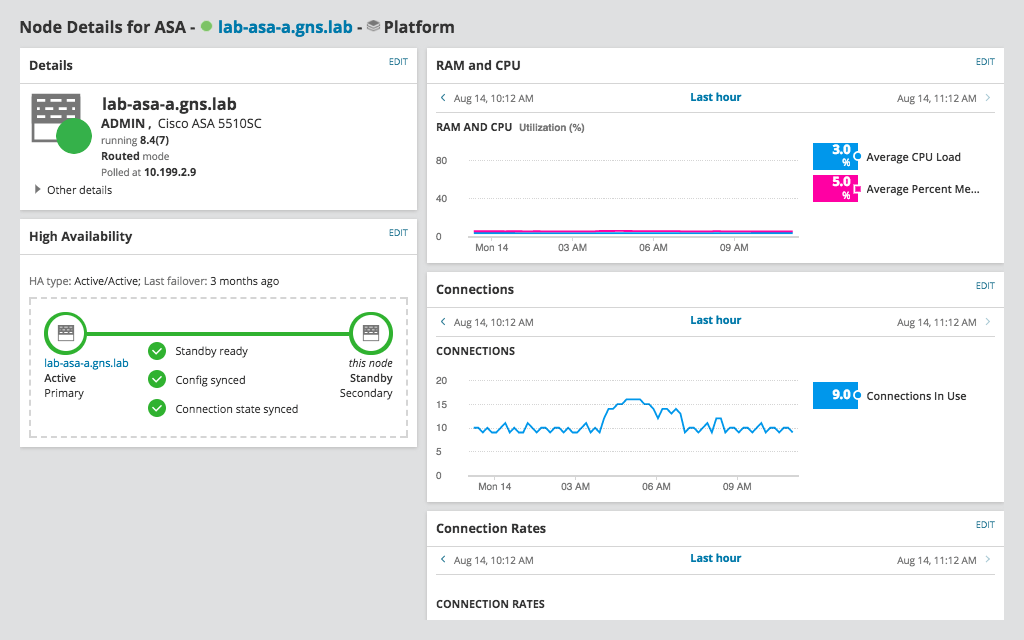
With network monitoring reports, a range of metrics can provide important insight into network baselines, hardware health, end-user experience, and other parameters for performance. To that end, network monitoring reports might focus on providing data related to:
Network monitoring reports can be especially useful when you run reports that compare your network’s historical data with current data. That helps you quickly identify issues that depart from the baseline, or you can more accurately forecast future network conditions.
Another key network performance issue is high network latency, related to internet or application lags, which can disrupt end users. With historical and real-time reporting data on latency and packet loss between nodes, you can more quickly pinpoint and resolve latency issues, allowing your clients, applications, and servers to continue working without network delays.
With all of this information conveniently gathered in comprehensive reports, you have what you need to help you resolve issues and redistribute resources to ensure your network is running smoothly and your end users aren’t affected.
It is possible to automate receiving and scheduling network reports when using a robust tool such as SolarWinds Network Performance Monitor.
There are a few ways to generate scheduled reports within NPM. You can schedule automated reports from the Schedule Manager or use the Report Manager to create and assign report schedules. If you’ve already created a report, you can set it to run automatically. To edit an already-existing report, you can assign it to a schedule with just a few clicks. You can also include a screenshot of a specific website at the time the report was generated by listing its URL on the schedule.
Once you’ve enabled scheduled network reports, you can automatically receive them at the designated time. Thanks to automated network reports, you can set up your schedule to receive up-to-date metrics when you need them. NPM also lets you share and restrict access to reports. You can then print these reports, save them, or share them via email with co-workers or customers.
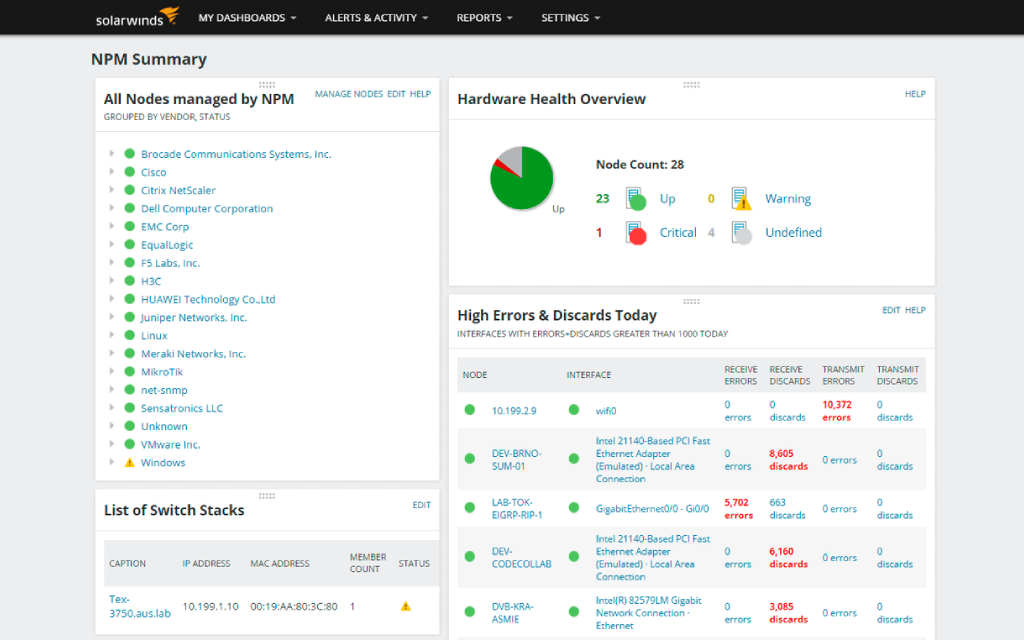
NPM allows you to create and manage reports from the web console, leveraging the capabilities built into the SolarWinds Orion Platform. Through the Orion Platform, NPM offers a number of predefined reports that users can easily modify, customizing metrics and adding inputs from pre-existing resources as needed. Accessing these predefined reports is as simple as clicking Reports then All Reports in the menu bar.
If none of the standard reports are quite what you’re looking for, you can create custom reports or modify web-based reports in the Orion Platform. Once a report is generated, you can view, schedule, print, export, and email it to colleagues or clients via the Orion Platform. Within reports, it is easy to create custom tables or charts to display data in a visual way.
In addition, you can use the Orion Platform to generate reports automatically according to a set schedule.
If you need a powerful and comprehensive network performance monitoring tool that offers detailed and actionable network performance monitoring reports, SolarWinds Network Performance Monitor (NPM) offers the capability you need. Thanks to the thorough network data documentation that NPM provides in its reports, you can effectively troubleshoot network performance issues and quickly analyze their root cause. More effectively reduce network downtime, forecast network outages, and quickly make data-based decisions.
As part of the SolarWinds Orion Platform, NPM is compatible with SolarWinds’ other in-depth tools, giving you even deeper insights into your network’s performance.
Network performance reporting is an essential step in network performance monitoring. While network performance monitoring provides real-time performance data for ongoing visibility, network reporting allows you to synthesize specific information in an easily digestible and shareable format.
Network performance reporting can be used and shared internally to gain important, actionable insights. With the help of a network performance report, you can quickly make informed decisions based on both current and historical data and metrics. By examining network reports and viewing capacity usage trends, you may be able to forecast, detect, diagnose, and resolve network issues before outages occur. You can better understand your organization's resource utilization trends and feel confident making decisions around optimizing your IT infrastructure and planning upgrades.
Network performance reporting is also critical for proving compliance with service-level agreements. Many organizations need to ensure they are meeting service-level agreements and quality of service standards, and reports provide a way to gather and view the relevant information. With customizable reports, it’s possible to easily pull and share the right information with specific departments or recipients.
A network monitoring report can include a range of network data that provides insight into performance, availability, and more.
With network monitoring reports, a range of metrics can provide important insight into network baselines, hardware health, end-user experience, and other parameters for performance. To that end, network monitoring reports might focus on providing data related to:
Network monitoring reports can be especially useful when you run reports that compare your network’s historical data with current data. That helps you quickly identify issues that depart from the baseline, or you can more accurately forecast future network conditions.
Another key network performance issue is high network latency, related to internet or application lags, which can disrupt end users. With historical and real-time reporting data on latency and packet loss between nodes, you can more quickly pinpoint and resolve latency issues, allowing your clients, applications, and servers to continue working without network delays.
With all of this information conveniently gathered in comprehensive reports, you have what you need to help you resolve issues and redistribute resources to ensure your network is running smoothly and your end users aren’t affected.
It is possible to automate receiving and scheduling network reports when using a robust tool such as SolarWinds Network Performance Monitor.
There are a few ways to generate scheduled reports within NPM. You can schedule automated reports from the Schedule Manager or use the Report Manager to create and assign report schedules. If you’ve already created a report, you can set it to run automatically. To edit an already-existing report, you can assign it to a schedule with just a few clicks. You can also include a screenshot of a specific website at the time the report was generated by listing its URL on the schedule.
Once you’ve enabled scheduled network reports, you can automatically receive them at the designated time. Thanks to automated network reports, you can set up your schedule to receive up-to-date metrics when you need them. NPM also lets you share and restrict access to reports. You can then print these reports, save them, or share them via email with co-workers or customers.
NPM allows you to create and manage reports from the web console, leveraging the capabilities built into the SolarWinds Orion Platform. Through the Orion Platform, NPM offers a number of predefined reports that users can easily modify, customizing metrics and adding inputs from pre-existing resources as needed. Accessing these predefined reports is as simple as clicking Reports then All Reports in the menu bar.
If none of the standard reports are quite what you’re looking for, you can create custom reports or modify web-based reports in the Orion Platform. Once a report is generated, you can view, schedule, print, export, and email it to colleagues or clients via the Orion Platform. Within reports, it is easy to create custom tables or charts to display data in a visual way.
In addition, you can use the Orion Platform to generate reports automatically according to a set schedule.
If you need a powerful and comprehensive network performance monitoring tool that offers detailed and actionable network performance monitoring reports, SolarWinds Network Performance Monitor (NPM) offers the capability you need. Thanks to the thorough network data documentation that NPM provides in its reports, you can effectively troubleshoot network performance issues and quickly analyze their root cause. More effectively reduce network downtime, forecast network outages, and quickly make data-based decisions.
As part of the SolarWinds Orion Platform, NPM is compatible with SolarWinds’ other in-depth tools, giving you even deeper insights into your network’s performance.
Network Performance Monitor
Use comprehensive fault monitoring and performance management
Get to the root cause quicker with intelligent dependency and topology-aware network alerts
Access hop-by-hop analysis of cloud or on-premises applications or services