- Events
-
Partners
- Government
- Customer Portal
- Contact Us
- Contact Sales
-
English
The many devices and systems making up your network are constantly producing log data for anything from basic performance insight to troubleshooting and root cause identification when problems arise. While it’s possible to try to make sense of all the data manually, you can save yourself the trouble—a log collector tool like SolarWinds® Log Analyzer is built to help you aggregate and organize logs and display them with a log viewer. Log Analyzer can help you aggregate logs from across your systems including syslogs, event logs, SNMP traps, and more.
To make sense of your collected log data, you first need it to be normalized. Since your devices and systems can generate different types of logs, it can be difficult to compare all your log data even if it’s been aggregated by a log collector tool.
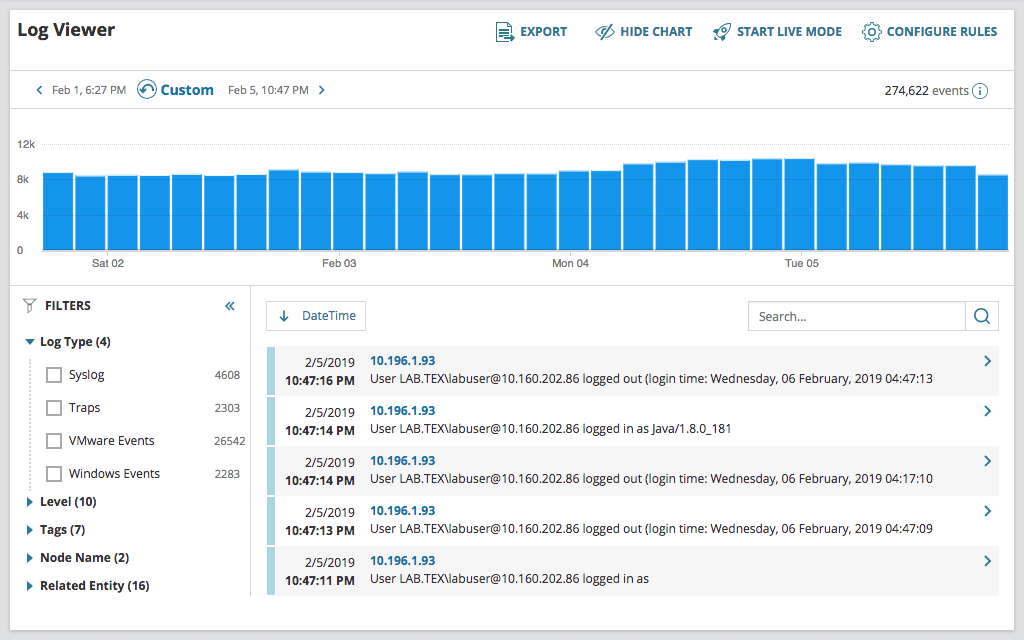
SolarWinds Log Analyzer can help you deal with this problem by normalizing your log data, so it’s in a single, intelligible format. The tool can also present the data in an interactive chart that lets you search through logs, visualize volume, and refine the timeframes of your collected log data to help give you a clearer image of your network performance.
Your network systems and devices produce a huge amount of log data. Even once it’s collected by a log collector tool, you still need some way to narrow the data to find what you’re looking for when troubleshooting a problem or optimizing performance.
SolarWinds Log Analyzer comes with a powerful search engine and intuitive, out-of-the-box filters designed to make it easier for you to find the logs you’re looking for, whether you have a specific file in mind or you’re looking for logs that could help you troubleshoot a problem.
While it’s great to have your logs collected and aggregated within your log collector tool, sometimes you need to share information about your logs and search results outside of the solution.
With SolarWinds Log Analyzer, it’s built to be easier to filter and export your search results to a CSV file. You can use those CSV files to share your search results with members of your team, attach results to a help ticket, or even archive the results for your historical records. Each record you export can include the date, time, IP address, severity level, node, message, and source.
Your logs can be an incredibly useful tool on their own for troubleshooting and performance optimization, but they can be even more powerful when they’re viewed alongside other network information, including performance metrics.
Since SolarWinds Log Analyzer can be integrated with the SolarWinds Orion® Platform, you can see Log Analyzer data alongside other SolarWinds tool insights to gain a deeper understanding into your network and system performance through a centralized dashboard.
A log collector is a tool that aggregates the logs from different sources across your system, normalizes them, and offers a way to view the logs more easily. While logs are a critical part of your system and integral to everything from troubleshooting problems to optimizing network and device performance, they can be difficult to understand without a log file collector to help make them usable. The goal of a log collector tool is to help automate and streamline the manual log management process.
Your system is constantly generating a huge amount of log information, whether it’s in the form of SNMP traps, syslogs, or Windows event logs. This data can offer crucial insights, but only if you know how to make sense of it. That’s where a log file collector comes in.
The best log collector works as a syslog collector, event log collector, Windows log collector, and more all in one. It combines log data from across your network and systems, including from devices, applications, services, and hosts. The log collector then gives you a single place where you can access these logs, which serve as records of the events that have occurred within your applications and infrastructure over time. More importantly, with an all in one log file collector, the data from those various sources can be normalized, so your log data is in a single, easy-to-read format. This helps make it easier not only to read the logs in the first place, but to understand how logs from different sources relate to each other, which can be critically important when it comes to troubleshooting problems.
Without a log collector tool, you run the risk of not detecting potential problems within your system until they’ve already had a major impact. Also, without a tool to collect logs and troubleshoot issues proactively, you may only be made aware of problems once end users are already affected.
Using a log collector is simple if it’s part of an effective solution designed to act as a syslog collector and more. The first step is downloading the log file collector onto your primary server. Once the log collector is installed, you can enable log collection on your various systems and devices right away, so the log collector tool can begin aggregating and normalizing logs.
Log collector tools like SolarWinds Log Analyzer are built to make it easier to find the devices and systems that require log collection with the help of a Discovery Wizard to automate some of the initial steps of the log collection process.
When a log collector is installed and operating across your system, you can begin gaining insights for any problems that may arise. One way to do this is by dropping unnecessary event logs to help streamline your log viewer. With the devices, applications, and systems in your network constantly producing logs, your log collector’s feed can get cluttered fast. By establishing rule parameters that discard your unwanted logs, you can help ensure the relevant logs are easier to find. Another way to improve your log collector is by applying tags to your event logs based on anything from keywords to the event ID to help you more easily identify specific log activity.
SolarWinds Log Analyzer is designed to be an effective, enterprise-grade log management solution with a log and syslog collector alongside tools like a log viewer and log analyzer.
Log Analyzer is built to be easy to install. Once you select which devices and systems you want to be included by the log collector, the tool can begin collecting and normalizing the logs right away. You can also use the tool’s log viewer to see a live feed of your logs as they’re created and collected, or you can search through historical logs.
The powerful and intuitive filters in Log Analyzer can also make it easier to focus on the specific logs related to whatever problem you are trying to identify or address. By seeing logs collected from across your system devices and applications, you can more easily identify the full impact of a problem and zero in on its root cause, so you can begin targeting the source of the problem.
Using Log Analyzer, you can view logs in several ways to help you better understand the data:
Log Analyzer is also an effective log and syslog collector and log management solution, with features to let you:
Log Analyzer
Collect and normalize logs from multiple sources.
Filter logs to find the information you’re looking for faster.
Integrate log data with performance metrics.