- Events
-
Partners
- Government
- Customer Portal
- Contact Us
- Contact Sales
-
English
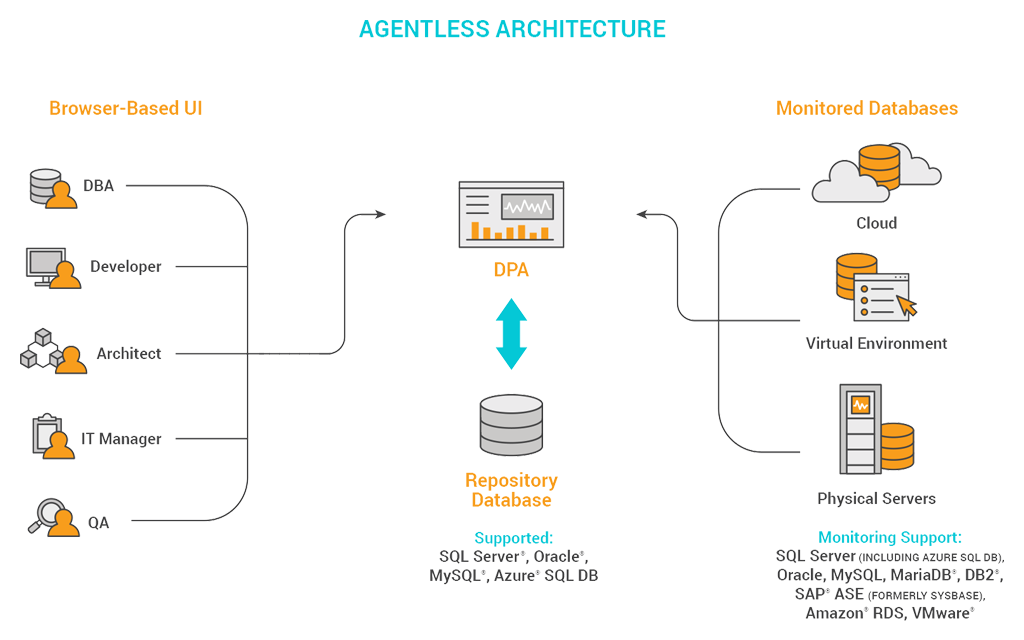
DPA is engineered to provide faster and more efficient monitoring that does not interfere with database performance as queries execute. DPA does not require any additional software or agents installed on the monitored server, and once up and running, the tool is built to use less than 1% load for each Sybase database monitoring instance.
DPA also offers multi-vendor support for Linux/Unix and Windows servers, and the DPA server can extend monitoring to SQL Server, Oracle, DB2, MySQL, and other databases in multi-vendor environments.
Sybase was a commercial database server company known for its Sybase ASE relational database offering (previously named Sybase SQL Server). Sybase databases are designed to leverage the benefits of in-memory capabilities to manage and process vast amounts of data from large numbers of users, keep response times to a minimum, and deliver high performance. This makes Sybase ASE servers especially useful for supporting transaction-based applications where high performance and global availability are crucial.
In 2010, SAP acquired Sybase and discontinued the name Sybase ASE in 2014.
A common goal of Sybase monitoring is to optimize and proactively prevent issues, helping you maximize system uptime and performance for each device and server. Key performance metrics to track for Sybase include:
Sybase database monitoring tools are designed to transform performance metrics into easy-to-read, actionable insights, so you can gain a deeper understanding of Sybase performance by continuously providing:
SolarWinds Database Performance Analyzer (DPA) is built to be a comprehensive database monitoring tool with robust Sybase monitoring features. DPA’s Sybase database monitoring tools can help you identify performance bottlenecks with the ability to check if high-demand applications meet appropriate service levels, while simultaneously helping you reduce operating expenses by pointing the potential for optimizing Sybase databases rather than expanding hardware resources.
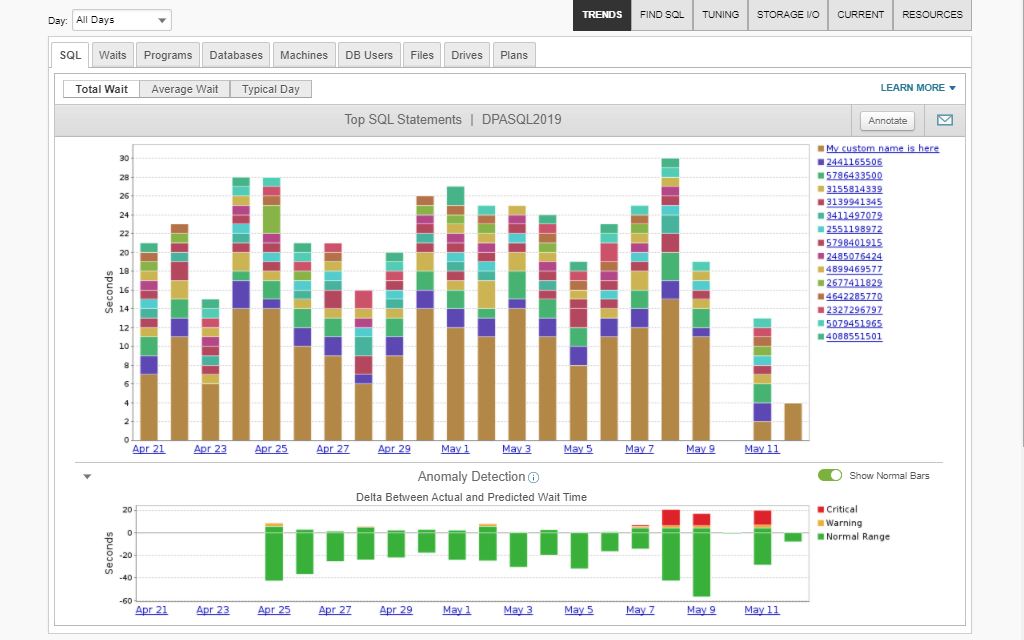
The Sybase monitoring dashboard in DPA allows you to monitor availability and performance in real time for each Sybase ASE database server. By monitoring granular performance and transactional data about individual queries and statements, DPA can help shine a light on what’s really causing performance issues. This helps you pinpoint and troubleshoot faster and resolve issues before they affect end users. DPA also allows you to configure acceptable performance ranges for each database server, then collects performance metrics directly from the Sybase database instance.
The Sybase monitoring software in DPA can be configured to auto-generate and deliver notifications to admins, IT managers, technicians, or other stakeholders when key parameters exceed critical thresholds. DPA is built to analyze performance metrics for signs of abnormalities to help you identify developing issues or problematic patterns. Automated remediation solutions (including an easy-to-use scripting wizard) can help further increase your productivity by eliminating the need for manual intervention when routine maintenance issues are detected.
DPA’s continuous, round-the-clock Sybase monitoring can allow you to find and resolve active performance bottlenecks by drilling down to the specific instance-level resources and uncovering what’s actually causing the problem—whether it’s excessive CPU utilization or spikes and drop-offs in total system I/Os. If a database is poorly or inefficiently designed, it could lead to problems with locking. Sybase could also be experiencing internal issues, which can create waits for latches and data buffers.
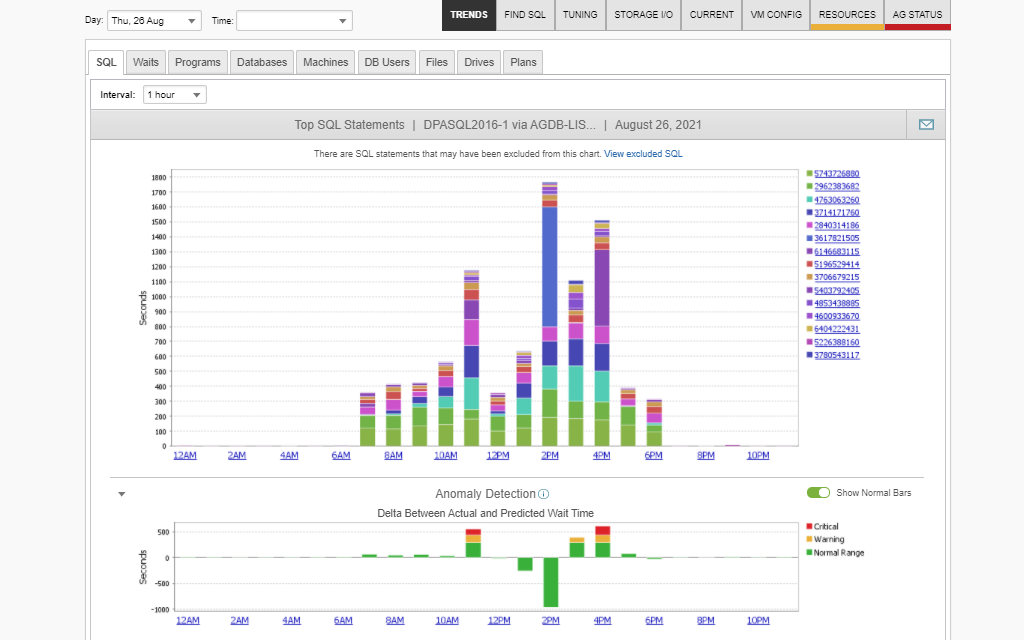
DPA allows you to review recent activity and performance data, which can make it easier to investigate historical or long-term performance issues that would otherwise be hard to track through real-time metrics monitoring alone.
DPA allows you to monitor Sybase ASE from a single installation of the program, without the need for additional client software. The DPA web console includes a SQL Stats Tuning Assistant that updates the DPA message log each hour based on performance metrics to indicate whether query tuning is recommended. The Sybase tool performance monitoring features included in DPA also enable you track every connection to the Sybase ASE server based on connection state—which often proves useful for identifying root-blockers, or the queries preventing other queries from being able to run.
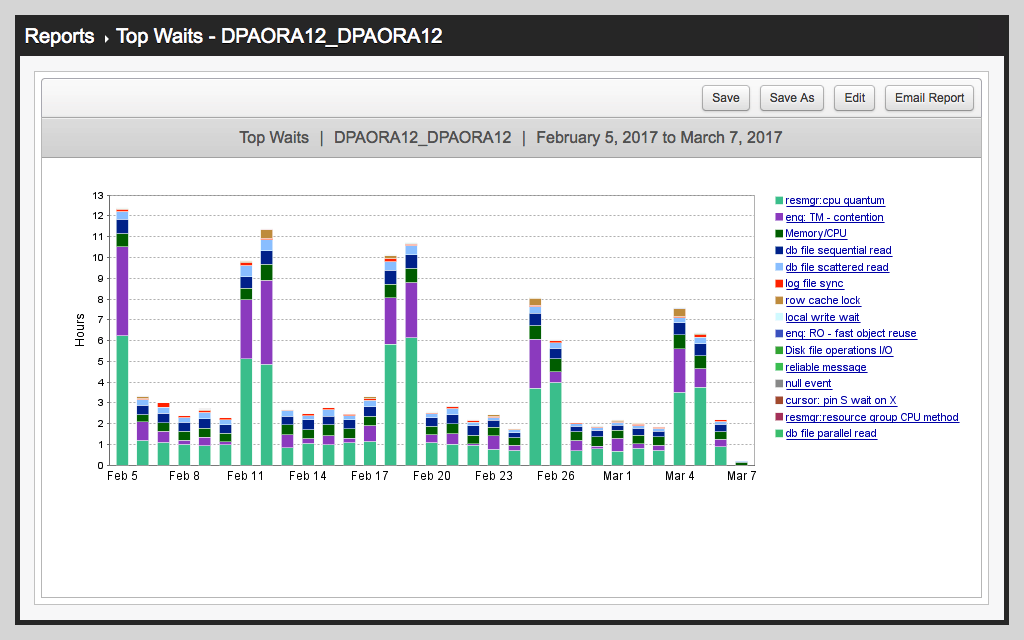
DPA’s reporting features are designed to translate performance information into easy-to-parse charts and reports, giving you what you need to resolve issues based on data from your own Sybase ASE servers. DPA’s Sybase database monitoring tools can help you refine and optimize database performance over time and are useful for capacity planning by providing historical baselines for resource utilization.
Sybase was a commercial database server company known for its Sybase ASE relational database offering (previously named Sybase SQL Server). Sybase databases are designed to leverage the benefits of in-memory capabilities to manage and process vast amounts of data from large numbers of users, keep response times to a minimum, and deliver high performance. This makes Sybase ASE servers especially useful for supporting transaction-based applications where high performance and global availability are crucial.
In 2010, SAP acquired Sybase and discontinued the name Sybase ASE in 2014.
A common goal of Sybase monitoring is to optimize and proactively prevent issues, helping you maximize system uptime and performance for each device and server. Key performance metrics to track for Sybase include:
Sybase database monitoring tools are designed to transform performance metrics into easy-to-read, actionable insights, so you can gain a deeper understanding of Sybase performance by continuously providing:
SolarWinds Database Performance Analyzer (DPA) is built to be a comprehensive database monitoring tool with robust Sybase monitoring features. DPA’s Sybase database monitoring tools can help you identify performance bottlenecks with the ability to check if high-demand applications meet appropriate service levels, while simultaneously helping you reduce operating expenses by pointing the potential for optimizing Sybase databases rather than expanding hardware resources.
The Sybase monitoring dashboard in DPA allows you to monitor availability and performance in real time for each Sybase ASE database server. By monitoring granular performance and transactional data about individual queries and statements, DPA can help shine a light on what’s really causing performance issues. This helps you pinpoint and troubleshoot faster and resolve issues before they affect end users. DPA also allows you to configure acceptable performance ranges for each database server, then collects performance metrics directly from the Sybase database instance.
The Sybase monitoring software in DPA can be configured to auto-generate and deliver notifications to admins, IT managers, technicians, or other stakeholders when key parameters exceed critical thresholds. DPA is built to analyze performance metrics for signs of abnormalities to help you identify developing issues or problematic patterns. Automated remediation solutions (including an easy-to-use scripting wizard) can help further increase your productivity by eliminating the need for manual intervention when routine maintenance issues are detected.
DPA’s continuous, round-the-clock Sybase monitoring can allow you to find and resolve active performance bottlenecks by drilling down to the specific instance-level resources and uncovering what’s actually causing the problem—whether it’s excessive CPU utilization or spikes and drop-offs in total system I/Os. If a database is poorly or inefficiently designed, it could lead to problems with locking. Sybase could also be experiencing internal issues, which can create waits for latches and data buffers.
DPA allows you to review recent activity and performance data, which can make it easier to investigate historical or long-term performance issues that would otherwise be hard to track through real-time metrics monitoring alone.
DPA allows you to monitor Sybase ASE from a single installation of the program, without the need for additional client software. The DPA web console includes a SQL Stats Tuning Assistant that updates the DPA message log each hour based on performance metrics to indicate whether query tuning is recommended. The Sybase tool performance monitoring features included in DPA also enable you track every connection to the Sybase ASE server based on connection state—which often proves useful for identifying root-blockers, or the queries preventing other queries from being able to run.
DPA’s reporting features are designed to translate performance information into easy-to-parse charts and reports, giving you what you need to resolve issues based on data from your own Sybase ASE servers. DPA’s Sybase database monitoring tools can help you refine and optimize database performance over time and are useful for capacity planning by providing historical baselines for resource utilization.
Database Performance Analyzer
Quickly drill down to the root cause of database performance issues and bottlenecks.
Identify and remediate potentially costly problems before they impact your systems.
Gain critical visibility into all Sybase database instances from a single console.