- Events
-
Partners
- Government
- Customer Portal
- Contact Us
- Contact Sales
-
English
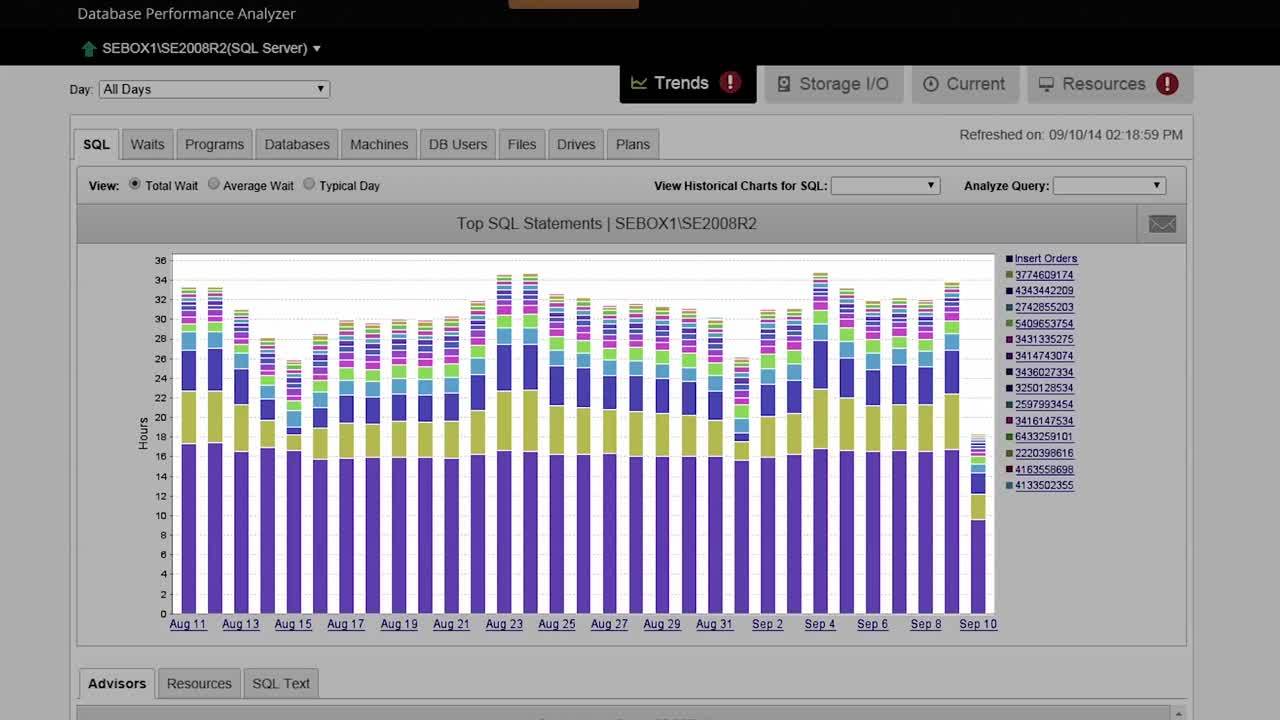
SolarWinds DPA is designed to support your ability to perform effective database tuning by providing in-depth views of top SQL statements, top wait types, SQL plans, blocked queries, missing indexes.
With its built-in Table Tuning Advisor feature, DPA can also display aggregated information about tables and inefficient queries at the end of each day. DPA also assigns a relative efficiency score to each query, so you can make more informed decisions about optimization opportunities.
SQL Server monitoring is continuous collection and analysis of usage, performance, and event metrics for Microsoft SQL Server. It’s the first step in optimizing performance for applications dependent on your data platform.
Highly effective monitoring gives a bird’s-eye view across your data estate. It also provides the deep analytics necessary to perform root cause analysis on the most challenging performance problems.
Baselines and historical data help measure and highlight performance trends. A comprehensive monitoring solution will also include extensive options for proactive alerting and automated remediation of familiar performance problems.
The most beneficial performance monitoring delivers the means to measure and improve SQL Server performance in one unified solution.
We cannot improve where we haven’t measured. Failing to monitor SQL Server performance often finds us unprepared when trying to solve urgent problems. Many performance challenges require replicating a scenario to pinpoint the root cause of a performance problem. Replicating a particular scenario from scratch is costly and might even prove to be impossible.
Your best defense against under-performing databases is monitoring your entire data platform stack. Monitoring should include from SQL Server and hypervisor hosts to stretch infrastructure in public, private, and hybrid cloud. What about analytics platforms such as SQL Server Analysis Services (SSAS)? Cloud platforms like Azure SQL Database and Amazon Web Services RDS for SQL Server are also a part of your overall data estate. All of these can be continuously monitored—and should be. If you’re only looking at full SQL Server instances, you have no visibility into other areas of your data platform.
SQL monitoring tools can provide alerts, troubleshooting help, and performance recommendations to help you resolve issues quicker, such as:
Reduce performance related incidents and outages.
Performance related incidents can be costly to your business. Proactive SQL Server performance monitoring leads to fewer performance related issues and fewer tickets to resolve. Free your team to focus on optimizing overall data platform performance and supporting other lines of business rather than constantly fighting fires.
Lower infrastructure cost
Maximize infrastructure investments by ensuring applications achieve the best possible performance within service and hardware boundaries. When you do need to upgrade cloud services or hardware, you can do so with confidence the decision won’t be wasteful.
Manage risk
Continuously monitoring performance to help keep your data platform running smoothly reduces the risk of downtime. Downtime can cost your business heavily in lost productivity and can place the data platform team into a harmful reactive posture.
Manually monitoring SQL Server can be tedious. You could spend hours each day gathering data from performance counters, event logs, and DMVs across potentially hundreds of servers and instances. This is before even considering how you might store and analyze historical information.
You’ll still need to format and present data in a logical and consumable fashion after collection. You now have even less time to solve real problems proactively.
DBAs who try to perform these tasks manually often abandon daily monitoring altogether.
The result is a perpetual cycle of reactive troubleshooting. This reactive stance reduces performance over the long term and can cost the business in lost revenue and productivity. Reactive posture places the data platform into an unpredictable state and forces DBAs to live with unyielding stress response.
Too much data can leave you confused as you sift through mountains of irrelevant information. Your monitoring solution should provide rich and timely detail of actionable performance information.
Too little information leads to incorrect or incomplete conclusions, which can be expensive. Imagine investing large amounts of time and capital to solve a problem that was never truly a problem. Holistic performance monitoring gives you the full picture of performance, guiding you to accurate conclusions.
A monitoring engine creating too much overhead adds to your problem rather than helping solve it. It defeats the purpose of monitoring, forcing you to trade resources for visibility.
DIY solutions cause ongoing maintenance headaches. Problems arise when you don’t remember who built the solution, or the person who built it can’t maintain it indefinitely. In many cases, the architect wasn’t an expert in performance monitoring, which can result in glaring functionality shortcomings.
SolarWinds Database Performance Analyzer is designed to offer several features to support effective SQL Server monitoring:
Database Performance Analyzer for SQL Server
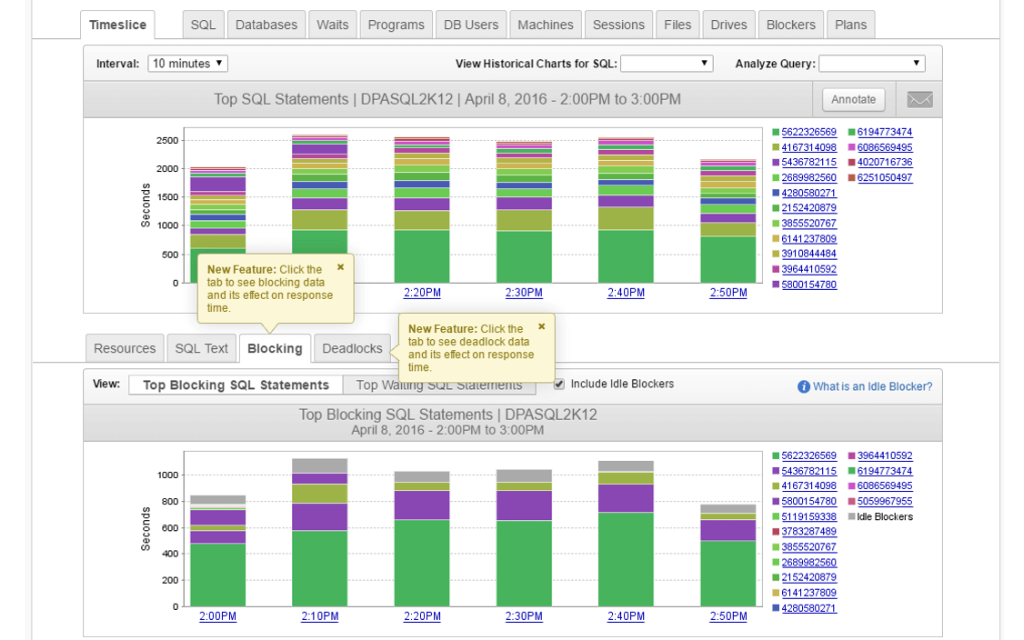
Easily identify blocked SQL queries with real-time SQL monitoring.
Analyze inefficient query code for preventative solutions.
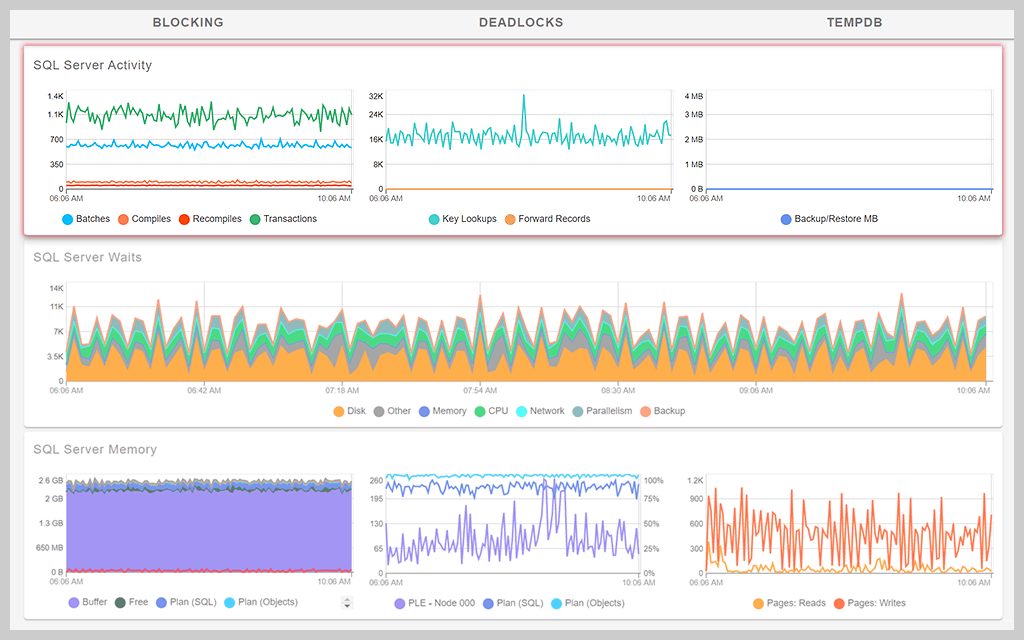
Monitor and alert on database health metrics with SQL Server monitoring tools.