- Events
-
Partners
- Government
- Customer Portal
- Contact Us
- Contact Sales
-
English
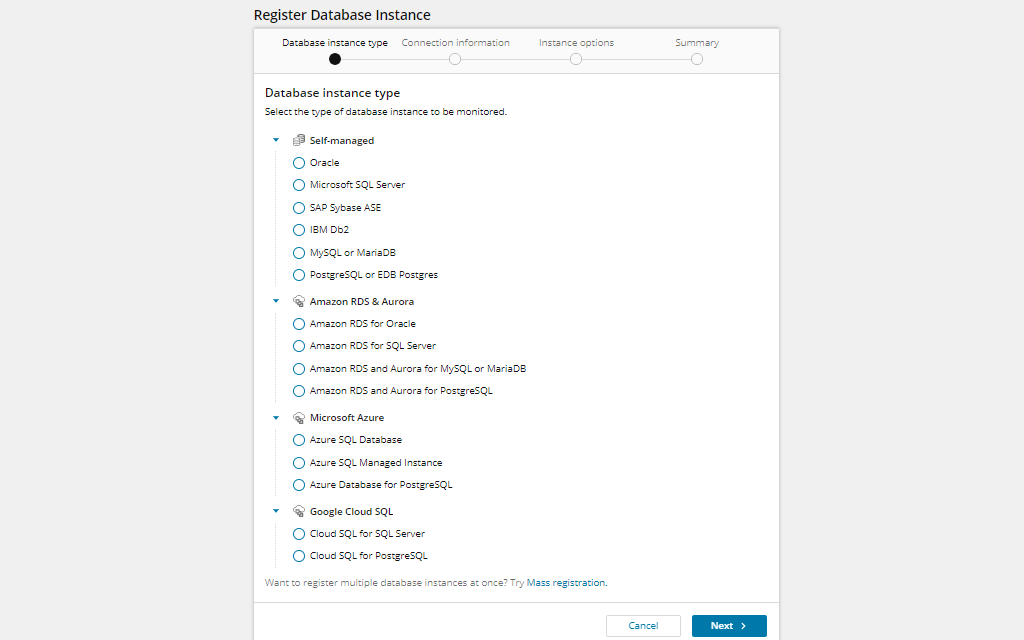
No matter where you run your PostgreSQL database instances, be it on a Linux or Windows Server, VMware virtual machine or cloud platform, SolarWinds® Database Performance Analyzer (DPA) has you covered.
Broad PostgreSQL platform support includes the following:
DPA’s hybrid approach to PostgreSQL database management provides a single-pane-of-glass view into database performance tuning and optimization with agentless architecture and less than 1% overhead.
DPA’s 24/7, down-to-the-second data collection measures a broad set of metrics for your PostgreSQL environment including key system metrics like disk, memory, and network. In addition, key PostgreSQL specific metrics are at your fingertips:
With these metrics and more, combined with real-time and historical views, DBAs have easy access to PostgreSQL tuning metrics.
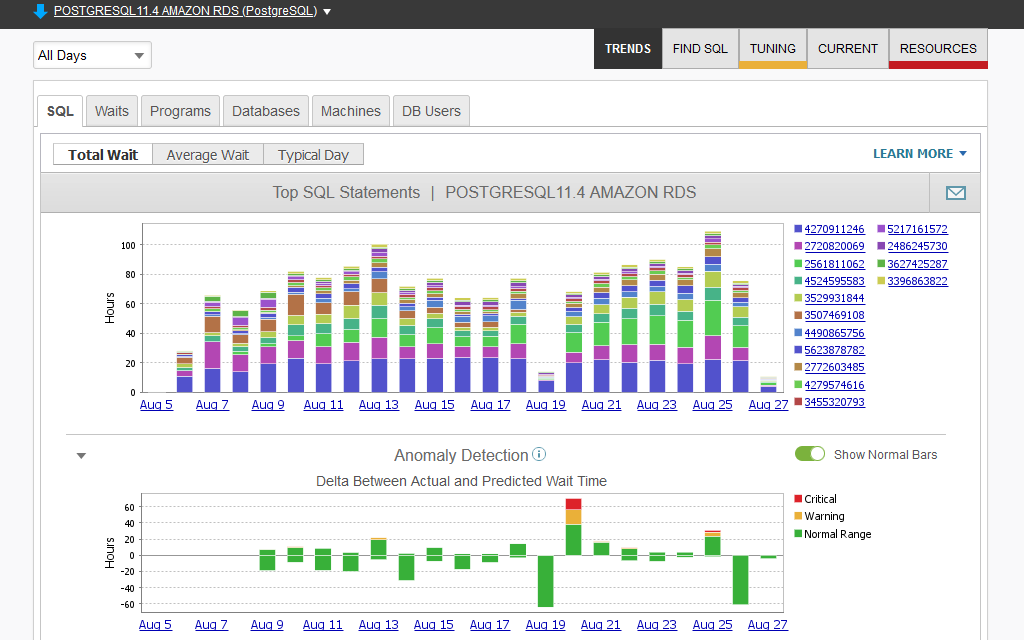
Machine learning that gets smarter over time is the basis for DPA’s anomaly detection, using seasonality to determine what’s normal and what isn’t. This powerful feature gives DBAs the ability to find performance issues—including those they weren’t aware of—typically in seconds.
Machine learning combined with advanced wait-time analysis shows why and where a query is being impacted, giving visibility into PostgreSQL optimization that legacy monitoring solutions can’t deliver.
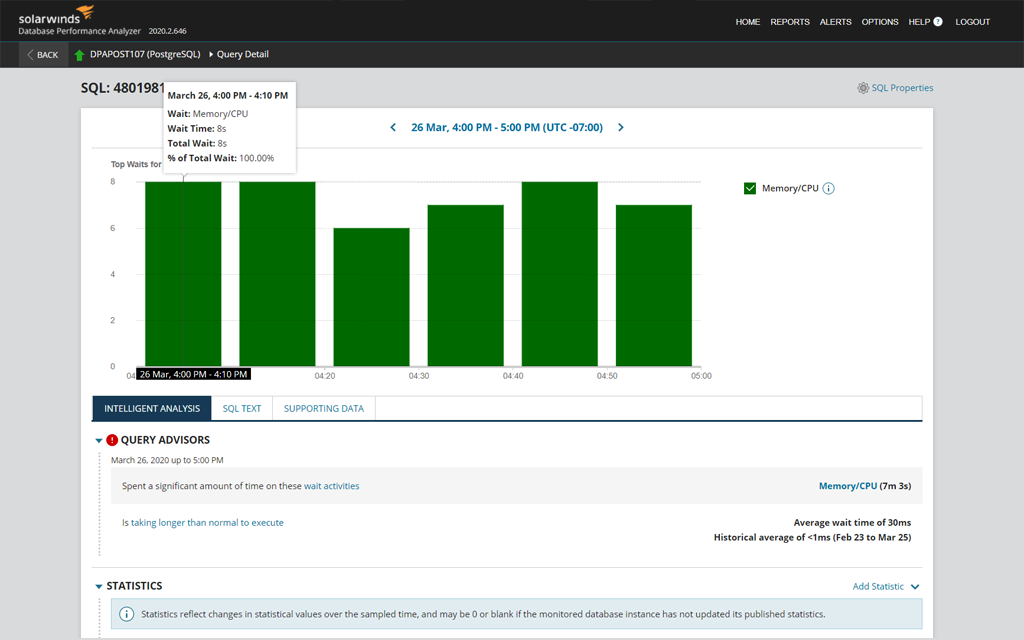
DPA takes PostgreSQL tuning a step further with expert advice via query advisors pointing out the culprits of performance degradation.
When you run PostgreSQL on a cloud computing platform, performance optimization and tuning are key, since you’re pay for compute resources and inefficient, poorly written queries can cost you money—not to mention the impact on front-end application performance.
DPA delivers a holistic approach to PostgreSQL performance management, including:
DPA can be implemented on a physical server or VM, in Azure, or as service in AWS.
DBAs are often the point person when it comes to PostgreSQL performance tuning and analysis. When someone complains about poor application performance, the database back end often gets first blame.
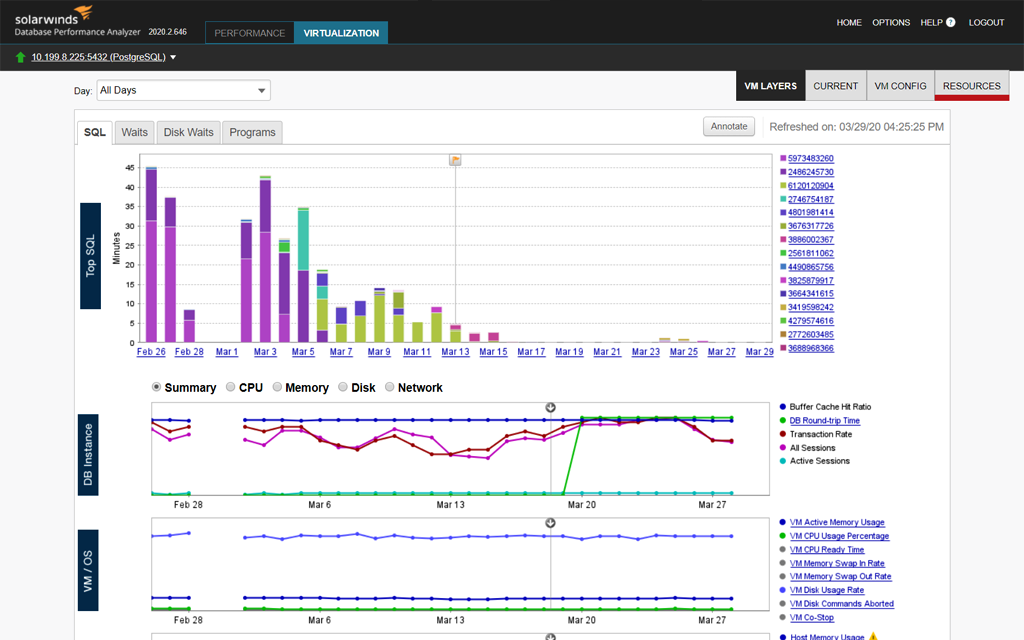
But what if the PostgreSQL instance is running in a VMware virtual machine? Many times, the DBA has zero visibility into the impact—if any—of the virtual infrastructure supporting the Postgres instance. Integrated virtualization monitoring via the DPA VM Option provides DBAs with the data they need to determine if the VM is causing performance issues for Postgres or not. From a unique “time slice” view layering VM metrics with database metrics to in-depth ESXi host metrics, DBAs are armed with the data they need to determine the impact on their PostgreSQL instance.
Known for its reliability, feature robustness, and high performance, PostgreSQL is a highly scalable, open-source database management system. Due to the amount of data and users it can accommodate, tuning PostgreSQL is critical for ensuring performance. To effectively optimize performance, database tuning often involves monitoring for deeper visibility into query trends.
Tuning with a PostgreSQL tuning tool can help support your efforts to gain insights more easily with the following features:
When tuning PostgreSQL, the following are common causes of performance issues and potential opportunities where tuning can help drive significant database performance improvements:
Using a Postgres query tuning tool, you can more easily evaluate whether a table or indexes may not be following PostgreSQL best practices. SolarWinds Database Performance Analyzer (DPA) includes a built-in table tuning advisor designed to list violations and recommend next steps. Some table tuning best practices you can more easily investigate and help solve for with SolarWinds DPA include:
Database tuning can help optimize database environments, so your applications can quickly access the data. Database tuning can also affect your ability to maintain database and application performance, data integrity, and controls.
Since PostgreSQL is an open-source database, it can often be complex and time-consuming to optimize performance. When building out PostgreSQL database queries and applications, you need a way to ensure optimization without the process being time-consuming or difficult.
PostgreSQL database tuning and related tools can provide you with the insights you need to tune more effectively and ultimately ensure more efficient implementations.
With a PostgreSQL tuning tool, database admins can observe query performance trends, view code and query changes, and gain insight into impacts from test and production databases using powerful features designed to help pinpoint issues quickly.
PostgreSQL tuning tools can provide “before and after” views of key database elements to allow you to compare performance, understand trends, and identify issues, such as:
Using a PostgreSQL performance tuning tool with a query analyzer, like SolarWinds Database Performance Analyzer (DPA), can also let you more easily visualize critical Postgres metrics using multi-dimensional query analysis to pinpoint performance issues.
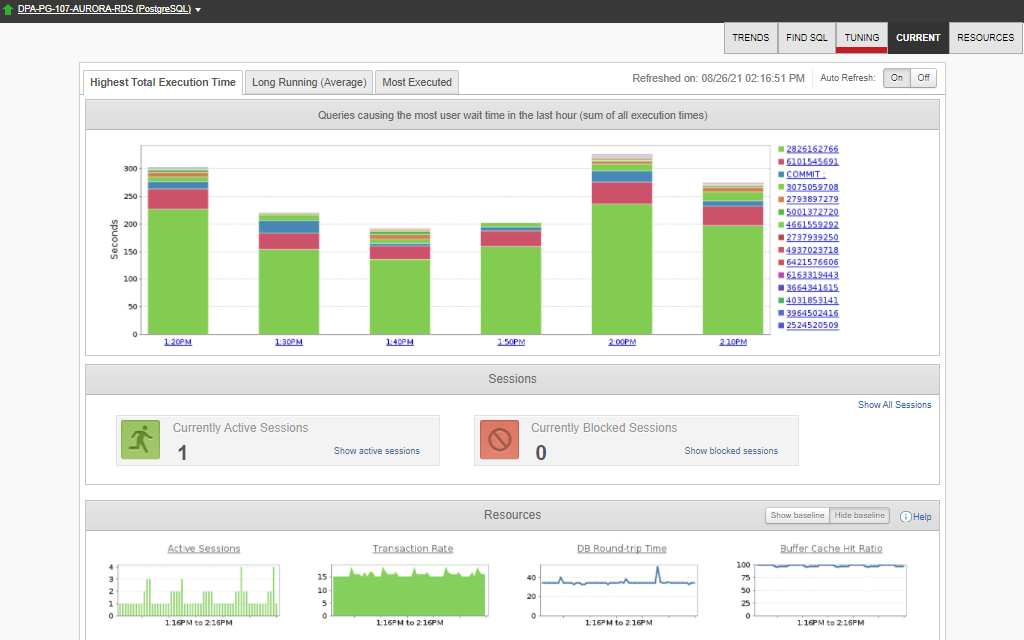
SolarWinds Database Performance Analyzer (DPA) offers key features DBAs need for effective PostgreSQL query tuning.
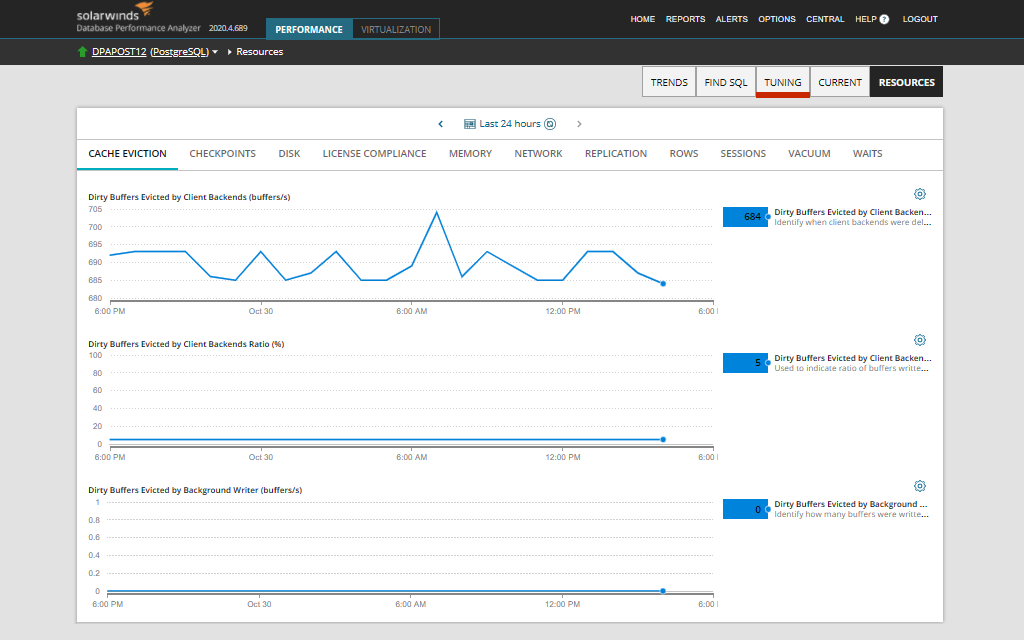
Effective tuning starts with the right metrics. As a PostgreSQL performance tuning tool, DPA is built to collect detailed metrics to help you understand how resources (such as CPU, disk, and memory) are being used at specific points in time. Important metrics include:
These metrics provided by the PostgreSQL tuning tool in DPA can help reveal what was happening in the rest of your environment during database slowdowns and provide context to help you identify the root cause of performance problems.
Viewing available PostgreSQL performance tuning metrics is designed to be quick and easy in DPA and can be achieved in about four steps from the Resources tab:
Another key part of the PostgreSQL performance tuning process is table tuning. The SolarWinds DPA PostgreSQL performance tuning tool is built to identify tables that had inefficient queries run against them. This table tuning advisor feature displays aggregated information about the table, the inefficient queries that ran against it, and any existing indexes. This information can help you make more informed decisions about the best course of action.
Known for its reliability, feature robustness, and high performance, PostgreSQL is a highly scalable, open-source database management system. Due to the amount of data and users it can accommodate, tuning PostgreSQL is critical for ensuring performance. To effectively optimize performance, database tuning often involves monitoring for deeper visibility into query trends.
Tuning with a PostgreSQL tuning tool can help support your efforts to gain insights more easily with the following features:
When tuning PostgreSQL, the following are common causes of performance issues and potential opportunities where tuning can help drive significant database performance improvements:
Using a Postgres query tuning tool, you can more easily evaluate whether a table or indexes may not be following PostgreSQL best practices. SolarWinds Database Performance Analyzer (DPA) includes a built-in table tuning advisor designed to list violations and recommend next steps. Some table tuning best practices you can more easily investigate and help solve for with SolarWinds DPA include:
Database tuning can help optimize database environments, so your applications can quickly access the data. Database tuning can also affect your ability to maintain database and application performance, data integrity, and controls.
Since PostgreSQL is an open-source database, it can often be complex and time-consuming to optimize performance. When building out PostgreSQL database queries and applications, you need a way to ensure optimization without the process being time-consuming or difficult.
PostgreSQL database tuning and related tools can provide you with the insights you need to tune more effectively and ultimately ensure more efficient implementations.
With a PostgreSQL tuning tool, database admins can observe query performance trends, view code and query changes, and gain insight into impacts from test and production databases using powerful features designed to help pinpoint issues quickly.
PostgreSQL tuning tools can provide “before and after” views of key database elements to allow you to compare performance, understand trends, and identify issues, such as:
Using a PostgreSQL performance tuning tool with a query analyzer, like SolarWinds Database Performance Analyzer (DPA), can also let you more easily visualize critical Postgres metrics using multi-dimensional query analysis to pinpoint performance issues.
SolarWinds Database Performance Analyzer (DPA) offers key features DBAs need for effective PostgreSQL query tuning.
Effective tuning starts with the right metrics. As a PostgreSQL performance tuning tool, DPA is built to collect detailed metrics to help you understand how resources (such as CPU, disk, and memory) are being used at specific points in time. Important metrics include:
These metrics provided by the PostgreSQL tuning tool in DPA can help reveal what was happening in the rest of your environment during database slowdowns and provide context to help you identify the root cause of performance problems.
Viewing available PostgreSQL performance tuning metrics is designed to be quick and easy in DPA and can be achieved in about four steps from the Resources tab:
Another key part of the PostgreSQL performance tuning process is table tuning. The SolarWinds DPA PostgreSQL performance tuning tool is built to identify tables that had inefficient queries run against them. This table tuning advisor feature displays aggregated information about the table, the inefficient queries that ran against it, and any existing indexes. This information can help you make more informed decisions about the best course of action.
Database Performance Analyzer
Cloud to on-premises coverage
Visibility into the metrics that matter
Machine learning + query advisors