- Events
-
Partners
- Government
- Customer Portal
- Contact Us
- Contact Sales
-
English
SolarWinds® Database Performance Analyzer (DPA) is designed to let you access collated, second-by-second data pulled from active sessions to better understand memory usage and know which SQL queries require your focus.
DPA is built to help database administrators (DBAs) more easily see different factors capable of influencing memory usage, including the following:
Understanding the root cause of SQL Server performance problems can require getting a full picture of your system. Optimizing memory typically relies on more than just memory-related metrics—the process often requires analyzing data from across the system.
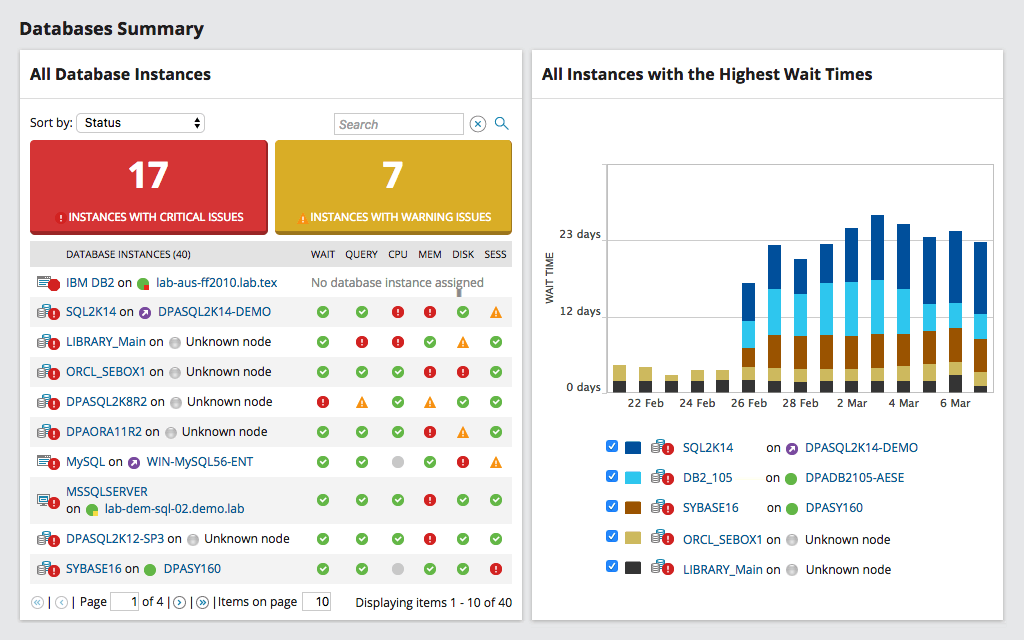
SolarWinds Database Performance Analyzer is designed to provide you with a direct correlation between response time and system resources—such as CPU, storage, and memory—from a single pane of glass. This correlated data can be found in the Resource Tab.
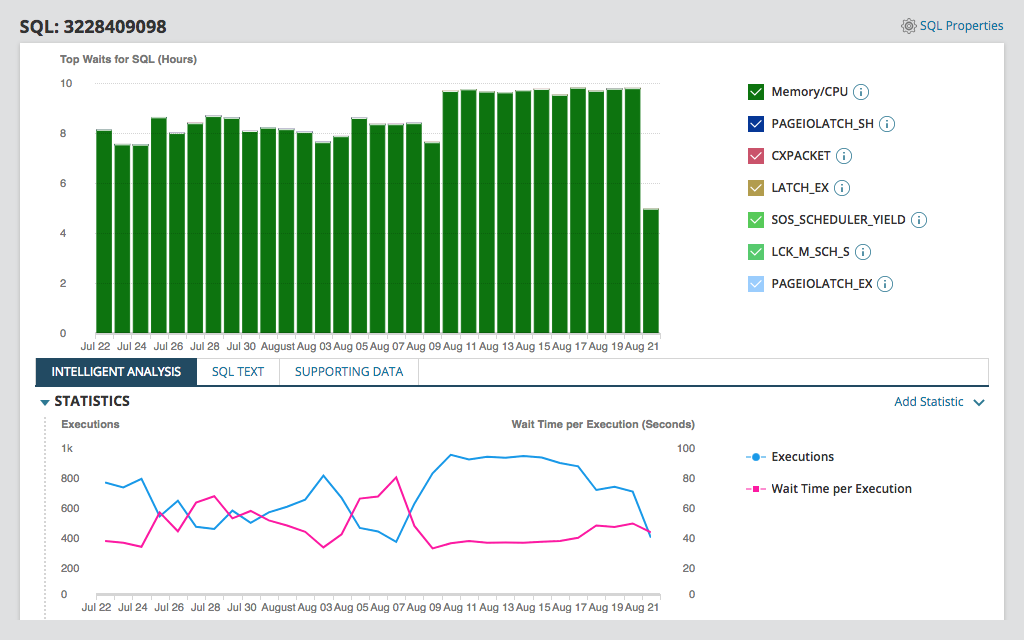
Monitoring page life expectancy (PLE) drops and correlating memory pressure with factors like large table scans and sorting is key to effectively allocating SQL memory. SolarWinds Database Performance Analyzer is designed to isolate the queries causing PLE drops and provide insights for optimization.
Optimizing queries also requires visibility into other performance metrics. DPA is built to help you gather this information, establish baselines, and maintain a history of best execution methods for SQL query optimization.
SolarWinds Database Performance Analyzer is built to collect cached execution plans in real time and link them with SQL statements, wait types, and other performance data. DPA stores this data’s history, allowing you to receive alerts about any plan changes causing performance degradation. DPA also displays compilations and recompilations per second, which is the metric for seeing whether execution plans are being reused—a good indicator of whether memory is being used optimally.
DPA offers easy, real-time SQL Server memory monitoring and collects data over time to create a comprehensive SQL Server memory usage history.
DPA is built to offer pinpointed advice on addressing and correcting issues potentially wasting memory. By comparing current and historical metrics, you have the contextual insight you need to help optimize memory utilization. You can also use DPA to compare current and historical data on server memory usage to better identify anomalous behavior.
Microsoft SQL Server utilizes memory to cache data and improve the server’s performance. By design, SQL Server reads data pages from disk into memory. It stores as many pages as you tell it to store and only evicts them as needed. When the server receives queries requiring pages it’s used before, it can retrieve them quickly from memory instead of having to create them from scratch.
It’s a common misconception that SQL Server uses up all your memory or hogs your memory resources. Because SQL Server works to optimize performance, it uses as much of the memory allocated to it as possible. However, it’s entirely up to you how much memory you allocate to SQL Server and how much you leave for other applications or the OS.
When it comes to system performance, there are three key elements working together to keep the system performing optimally: CPU, storage, and memory. Memory needs to be allocated effectively to prevent performance bottlenecks.
Determining how much memory to allocate SQL Server is a challenging task requiring you to consistently monitor SQL Server memory usage. By monitoring and maximizing your SQL Server memory, you can improve your SQL Server performance and the server’s query response times.
SQL Server memory usage monitoring involves your Database Administrator (DBA) looking at measurements of memory usage within your entire computer system—not just for SQL Server—and using this data to properly allocate your finite memory resources.
The main goal of SQL Server memory usage monitoring is to determine how much memory should be designated for SQL Server without compromising the performance of the operating system or other applications. To achieve this, you need to monitor your system’s performance metrics and use this data to influence your SQL Server memory tuning.
Several factors can influence your larger computer system’s memory usage. Monitoring and optimizing SQL memory usage involves locating data on these factors so you can determine which SQL queries need your attention. Here are some of the factors influencing memory usage:
When it comes to SQL Server memory usage, monitoring involves looking at the SQL Server memory consumption report you can find in any system with a SQL Server. This report provides information in sections and includes the following:
Monitoring this data allows you to better determine what you should set as the max memory for your SQL Server and how you should adjust this maximum as your needs and uses change.
Though it’s possible to monitor SQL Server memory usage manually, it can be challenging to constantly locate and compare metrics, all of which are found on different screens and within different tools. Instead, it’s best to use a single tool to help with your SQL Server memory monitoring needs. SolarWinds® Database Performance Analyzer, which is built to collect relevant data, correlate it, and present it in a single pane of glass, is one such tool.
Monitoring SQL Server memory usage is important because it’s directly correlated with SQL Server performance. It has a major impact on how quickly queries are executed.
By monitoring PLE as part of your general SQL Server memory usage monitoring, you can determine whether SQL Server is running low on buffer memory. This can indicate you’re missing indexes, or your SQL statements are poorly written.
Unfortunately, the default memory usage settings in SQL Server are usually far from ideal. If you don’t optimize these settings, you might feel like the only way to improve your performance is by investing in more memory. This costly endeavor won’t fix the problem. Instead, it’ll just act as a Band-Aid until you run out of memory again and are forced to purchase more and more.
By monitoring SQL Server memory usage and applying the insights you gain from it, you can tackle the problems causing your performance issues head-on. By optimizing your memory usage, you can even improve your SQL Server performance without wasting money on more memory.
A SQL Server memory usage monitoring tool provides you with the necessary insights into your system to optimize your SQL Server performance and improve the server’s memory usage. These tools don’t just let you see information about the different factors influencing memory usage; they give you visibility into the performance metrics required to optimize bad or expensive queries.
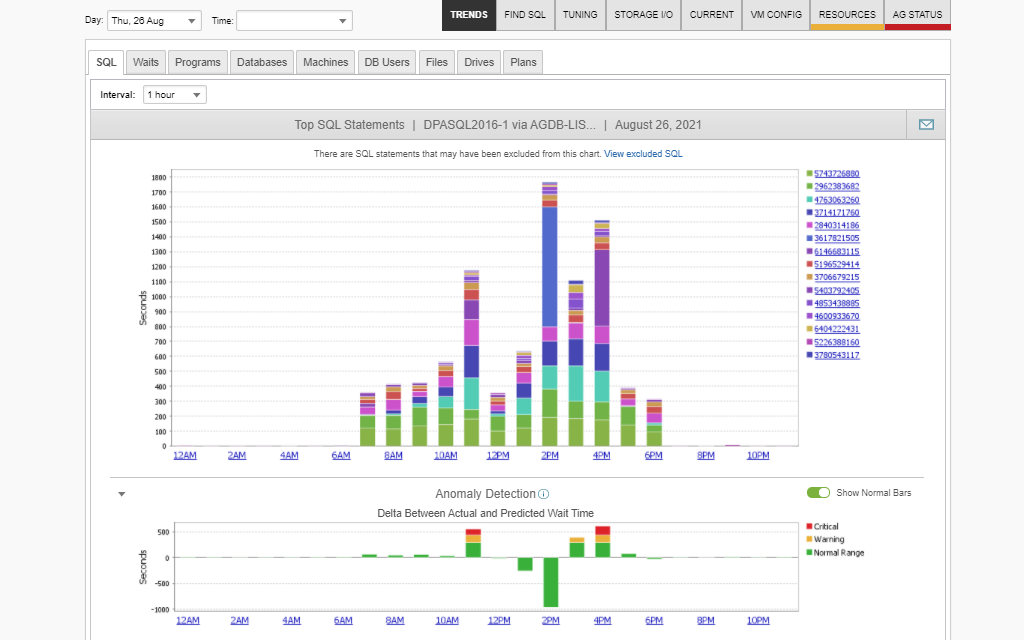
SQL Server memory usage monitoring tools help DBAs identify which SQL queries to focus on by pulling and collating second-by-second data from active sessions. They also rank SQL statements by their response times, so you can better identify where problems lie.
With a monitoring tool, you can see the direct correlation between response time and system resources—such as CPU, storage, and memory—from a single pane of glass. By providing visibility into performance metrics such as average execution, query duration, CPU time, logical/physical reads, and more, monitoring tools help you gather information, establish baselines, and maintain a history of the best execution methods for effective SQL query optimization.
When it comes to memory, one of the biggest benefits of using a tool for SQL Server monitoring is the tool is designed to constantly collect information about page life expectancy and plan cache size.
Page life expectancy, or PLE, is the number of seconds a page stays in the buffer pool without references. The longer the page stays in memory, the greater the chances the page will be reused. Drops in PLE indicate pages aren’t staying in memory for other uses. This behavior usually occurs when SQL Server is running low on buffer memory. Typically, poorly written SQL statements or missing indexes can cause SQL Server to use too much memory because the query is reading too much data to return a much smaller result set. Proper indexing and well-written queries can reduce memory stress, optimizing memory usage.
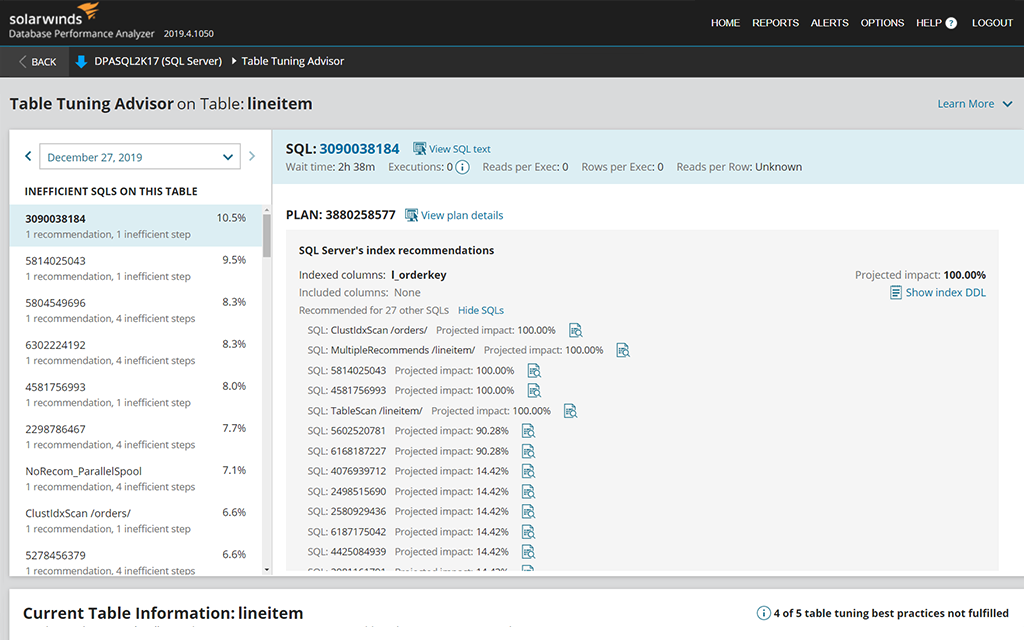
The plan cache looks at the buffer pool size and shows the memory size configured. Every time a SQL statement is executed, the engine searches to see whether the plan for the SQL statement already exists. If it does, the engine makes use of it instead of wasting time compiling a new plan. This is how the plan cache improves the efficiency of the SQL Server engine. Storing a query plan for a statement executed only once is called a single-use plan. Too many single-use plans can exhaust SQL Server memory and result in poor SQL Server performance.
By consistently monitoring and providing detailed data on these two metrics, a SQL Server memory usage monitoring tool can provide DBAs with the information they need to effectively adjust and optimize their SQL Server memory allocation and their SQL queries in general.
SolarWinds Database Performance Analyzer is designed to collect the information you need to effectively allocate SQL Server memory. With DPA, you can stop guessing by drilling down with the SQL Server performance analyzer tool to pinpoint the root cause of poor SQL Server performance.
DBAs often add more memory to speed up SQL Server performance, but this doesn’t address the issue of poorly written queries capable of quickly consuming available memory. There’s a better way to effectively optimize memory usage to accelerate SQL Server performance. This is where DPA comes in.
DPA is designed to help you view the direct correlation between response time and system resources, including CPU, storage, and memory. The Resource Tab shows you this correlation, so you can better identify which resources or elements of your system are at the root of performance issues.
DPA also monitors PLE and plan cache to better determine whether SQL Server is making the most of its allocated memory. DPA can collect cached execution plans in real time and links them with SQL statements, wait types, and other performance data.
Instead of endlessly purchasing more memory without addressing the root problem, let DPA help you optimize your SQL Server memory usage. With 24/7 SQL Server monitoring, DPA can help you determine why performance is subpar and what you can do to fix the problem.
Microsoft SQL Server utilizes memory to cache data and improve the server’s performance. By design, SQL Server reads data pages from disk into memory. It stores as many pages as you tell it to store and only evicts them as needed. When the server receives queries requiring pages it’s used before, it can retrieve them quickly from memory instead of having to create them from scratch.
It’s a common misconception that SQL Server uses up all your memory or hogs your memory resources. Because SQL Server works to optimize performance, it uses as much of the memory allocated to it as possible. However, it’s entirely up to you how much memory you allocate to SQL Server and how much you leave for other applications or the OS.
When it comes to system performance, there are three key elements working together to keep the system performing optimally: CPU, storage, and memory. Memory needs to be allocated effectively to prevent performance bottlenecks.
Determining how much memory to allocate SQL Server is a challenging task requiring you to consistently monitor SQL Server memory usage. By monitoring and maximizing your SQL Server memory, you can improve your SQL Server performance and the server’s query response times.
SQL Server memory usage monitoring involves your Database Administrator (DBA) looking at measurements of memory usage within your entire computer system—not just for SQL Server—and using this data to properly allocate your finite memory resources.
The main goal of SQL Server memory usage monitoring is to determine how much memory should be designated for SQL Server without compromising the performance of the operating system or other applications. To achieve this, you need to monitor your system’s performance metrics and use this data to influence your SQL Server memory tuning.
Several factors can influence your larger computer system’s memory usage. Monitoring and optimizing SQL memory usage involves locating data on these factors so you can determine which SQL queries need your attention. Here are some of the factors influencing memory usage:
When it comes to SQL Server memory usage, monitoring involves looking at the SQL Server memory consumption report you can find in any system with a SQL Server. This report provides information in sections and includes the following:
Monitoring this data allows you to better determine what you should set as the max memory for your SQL Server and how you should adjust this maximum as your needs and uses change.
Though it’s possible to monitor SQL Server memory usage manually, it can be challenging to constantly locate and compare metrics, all of which are found on different screens and within different tools. Instead, it’s best to use a single tool to help with your SQL Server memory monitoring needs. SolarWinds® Database Performance Analyzer, which is built to collect relevant data, correlate it, and present it in a single pane of glass, is one such tool.
Monitoring SQL Server memory usage is important because it’s directly correlated with SQL Server performance. It has a major impact on how quickly queries are executed.
By monitoring PLE as part of your general SQL Server memory usage monitoring, you can determine whether SQL Server is running low on buffer memory. This can indicate you’re missing indexes, or your SQL statements are poorly written.
Unfortunately, the default memory usage settings in SQL Server are usually far from ideal. If you don’t optimize these settings, you might feel like the only way to improve your performance is by investing in more memory. This costly endeavor won’t fix the problem. Instead, it’ll just act as a Band-Aid until you run out of memory again and are forced to purchase more and more.
By monitoring SQL Server memory usage and applying the insights you gain from it, you can tackle the problems causing your performance issues head-on. By optimizing your memory usage, you can even improve your SQL Server performance without wasting money on more memory.
A SQL Server memory usage monitoring tool provides you with the necessary insights into your system to optimize your SQL Server performance and improve the server’s memory usage. These tools don’t just let you see information about the different factors influencing memory usage; they give you visibility into the performance metrics required to optimize bad or expensive queries.
SQL Server memory usage monitoring tools help DBAs identify which SQL queries to focus on by pulling and collating second-by-second data from active sessions. They also rank SQL statements by their response times, so you can better identify where problems lie.
With a monitoring tool, you can see the direct correlation between response time and system resources—such as CPU, storage, and memory—from a single pane of glass. By providing visibility into performance metrics such as average execution, query duration, CPU time, logical/physical reads, and more, monitoring tools help you gather information, establish baselines, and maintain a history of the best execution methods for effective SQL query optimization.
When it comes to memory, one of the biggest benefits of using a tool for SQL Server monitoring is the tool is designed to constantly collect information about page life expectancy and plan cache size.
Page life expectancy, or PLE, is the number of seconds a page stays in the buffer pool without references. The longer the page stays in memory, the greater the chances the page will be reused. Drops in PLE indicate pages aren’t staying in memory for other uses. This behavior usually occurs when SQL Server is running low on buffer memory. Typically, poorly written SQL statements or missing indexes can cause SQL Server to use too much memory because the query is reading too much data to return a much smaller result set. Proper indexing and well-written queries can reduce memory stress, optimizing memory usage.
The plan cache looks at the buffer pool size and shows the memory size configured. Every time a SQL statement is executed, the engine searches to see whether the plan for the SQL statement already exists. If it does, the engine makes use of it instead of wasting time compiling a new plan. This is how the plan cache improves the efficiency of the SQL Server engine. Storing a query plan for a statement executed only once is called a single-use plan. Too many single-use plans can exhaust SQL Server memory and result in poor SQL Server performance.
By consistently monitoring and providing detailed data on these two metrics, a SQL Server memory usage monitoring tool can provide DBAs with the information they need to effectively adjust and optimize their SQL Server memory allocation and their SQL queries in general.
SolarWinds Database Performance Analyzer is designed to collect the information you need to effectively allocate SQL Server memory. With DPA, you can stop guessing by drilling down with the SQL Server performance analyzer tool to pinpoint the root cause of poor SQL Server performance.
DBAs often add more memory to speed up SQL Server performance, but this doesn’t address the issue of poorly written queries capable of quickly consuming available memory. There’s a better way to effectively optimize memory usage to accelerate SQL Server performance. This is where DPA comes in.
DPA is designed to help you view the direct correlation between response time and system resources, including CPU, storage, and memory. The Resource Tab shows you this correlation, so you can better identify which resources or elements of your system are at the root of performance issues.
DPA also monitors PLE and plan cache to better determine whether SQL Server is making the most of its allocated memory. DPA can collect cached execution plans in real time and links them with SQL statements, wait types, and other performance data.
Instead of endlessly purchasing more memory without addressing the root problem, let DPA help you optimize your SQL Server memory usage. With 24/7 SQL Server monitoring, DPA can help you determine why performance is subpar and what you can do to fix the problem.
Database Performance Analyzer for SQL Server
Use 24/7 SQL Server monitoring to help determine the root cause of performance issues.
View the correlation between SQL query response time and system resources, including memory, CPU, and storage.
Access collated, second-by-second data pulled from active sessions to optimize SQL Server performance.