- Events
-
Partners
- Government
- Customer Portal
- Contact Us
- Contact Sales
-
English

Website performance monitoring is the process of measuring and testing how a website, web application, or other web-based service responds during end-user interactions, with the end goal of ensuring each service functions as expected.
With the data website performance monitoring provides, admins can more easily perform website speed optimization, reduce bounce rates, and increase ease of use and satisfaction for end users. With website performance monitoring, admins have the information they need to make adjustments and reallocate resources to maximize performance.
Using website performance monitoring tools, network administrators can collect data related to internet latency, network hop issues, and other metrics to help build a snapshot of the website or server’s performance. These various data streams are then translated into report, graph, or chart form, allowing for quick, at-a-glance comprehension of the overall state of the website.

Website performance monitoring can help users ensure their organization’s web services are fast and effective for end users by helping identify issues, ideally before impacting performance.
Performance monitoring is also important because poor website performance can have real business impacts. For instance, a slow and inefficient website can quickly result in reduced visitor traffic. The result of these slowdowns can be lost revenue and a tarnished brand.

Admins who are monitoring website performance need to be able to effectively gather data about websites and web-based services to ensure the site and services are meeting established levels of speed, uptime, and reliability. This is why, when choosing a website performance monitoring solution, it’s crucial to select one offering the following features:
![]()
Website performance monitoring tools are designed to rely on networked computer checkpoints in various physical locations engaging with the website or web service to determine whether the asset is operating as intended. Each checkpoint goes through a set of steps, which generate the performance metrics used to determine the site’s efficiency. The most basic steps are:
These steps measure the basic availability of the asset, after which the checkpoint will report the results of the test. More advanced monitoring tests will include additional steps:
For web applications, the checkpoint will attempt to perform several basic functions—from logging and searching to using the shopping cart or completing a purchase—to ensure the application is operating correctly.
If the website performance tools detect errors or unexpectedly slow response times, the checkpoint may run follow-up tests to determine whether the error or latency is an isolated incident or potentially indicative of a large, more persistent problem.
Website performance monitoring solutions are built to effectively gather data about websites and web-based services, but they’re only as effective as the metrics they track. While the specific metrics businesses monitor will vary website by website, when considering which website speed monitoring tool to choose, here are several core indicators to monitor.
The most important metric website performance monitoring tools need to track is uptime, which measures the percentage of time a given device—such as a web server—has been working and is available. Time to first byte (or TTFB) is another important metric, and monitoring solutions should be able to send site requests from various locations, so administrators are able to compare page load times across different regions. Full page load time is another important measurement, as are broken links, user journey, and database performance. Monitoring tools are designed to track and establish baseline operational parameters for each of these metrics, which ultimately helps admins to identify potential bottlenecks, slowdowns, and opportunities for optimization.
In addition to offering a comprehensive range of metrics and data streams to be monitored, the best website performance monitoring tools will include features like customizable reports, graphs, charts, and alerts, so admins and support staff can create a consistent user experience regardless where the site or service is accessed.

Ensuring your website remains online and accessible is crucial to staying competitive for many businesses in today’s worldwide digital market. Website monitoring tools designed to keep you informed of outages and potential performance issues are a key part of maintaining business-critical functions.
To help determine whether you’ve picked the right website monitoring solution for your organization, run through the following checklist of essential website performance monitoring requirements:

SolarWinds® Web Performance Monitor is a robust software-as-a-service (SaaS) website performance tool designed to detect and help resolve internal and external performance issues.
SolarWinds WPM can help automate web transactions and measure the response time of web-based devices and services and puts network admins and webmasters more in control of the performance aspects of their sites, servers, applications, and other services. Able to monitor anywhere from one application to hundreds, WPM helps to swiftly identify performance issues, helping you fix the root cause of the issue before it can affect the end-user experience and your business’s bottom line.
WPM also centralizes the collection performance metrics into a single, intuitive dashboard that can be customized to fit the specific needs of your organization’s websites and other assets.
Some of WPM’s key features include complete performance monitoring, including web user experience monitoring and continuous synthetic transaction monitoring. Detailed load-time metrics allow you to identify specific web page elements potentially slowing down overall performance, while WPM’s web monitoring functionality makes it easier to diagnose latency issues.
WPM also comes out of the box with predefined reporting templates capable of being tailored to suit your specific needs, including page load speeds, transaction health, and website uptime reports.
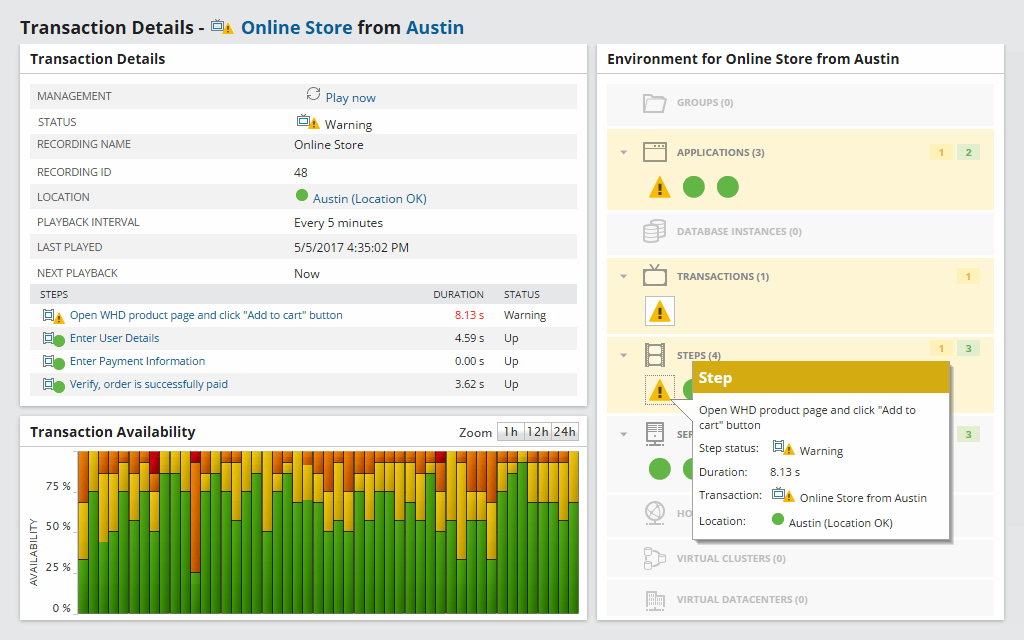
WPM is built to provide continuous monitoring of the end-user experience, which can offer valuable insights and performance data about each step of the web transaction and allow you to easily track response time, duration, any alerts, dependencies, and other metrics. WPM also gives you the ability to monitor web applications regardless whether they are behind your firewalls, customer-facing, or cloud-based.
One useful feature WPM offers is the ability to record a series of web transactions and to then run them against your web servers and SaaS applications at scheduled times and from different locations, to simulate end-user experiences. These transactions can include mouse and keyboard input, content downloads, and matching text strings—which WPM captures without you needing technical training or additional staff.
By running a similar set of transactions repeatedly, WPM uses your actual website and web services responses to generate a record of empirical evidence to establish the expected performance baselines for your web-based assets. This makes it even easier to spot and fix performance before they can affect end users—especially when paired with the ability to locate the root cause of the performance issues through a rapid examination of DNS lookup data, content download time, connection time, and other metrics. WPM also allows you to test the end-user experience across different screen resolutions—something the web transaction recorder function can also emulate across devices.
WPM helps provide transparent visibility across the entirety of your supporting architecture. By mapping the relationship between a transaction and each of the servers, databases, storage resources, and other infrastructural elements, WPM allows you to see how the end-user experience interacts with assets across your entire network stack.
Web Performance Monitor
Monitor web and SaaS application performance.
Experience your app like a user.
Know how long your users are waiting.


