- Events
-
Partners
- Government
- Customer Portal
- Contact Us
- Contact Sales
-
English
Reduce network outages and quickly detect, diagnose, and resolve multi-vendor network performance issues with affordable, easy-to-use network monitoring software.
Reduce the flood of unnecessary network alerts. Create alerts based on simple or complex nested trigger conditions, defined parent/child dependencies, and network topology.
Monitor critical business services on-prem or in the cloud with NetPath network path analysis. You can see changes along the path, identify service provider issues, and use historical views to review the path before a problem occurs.
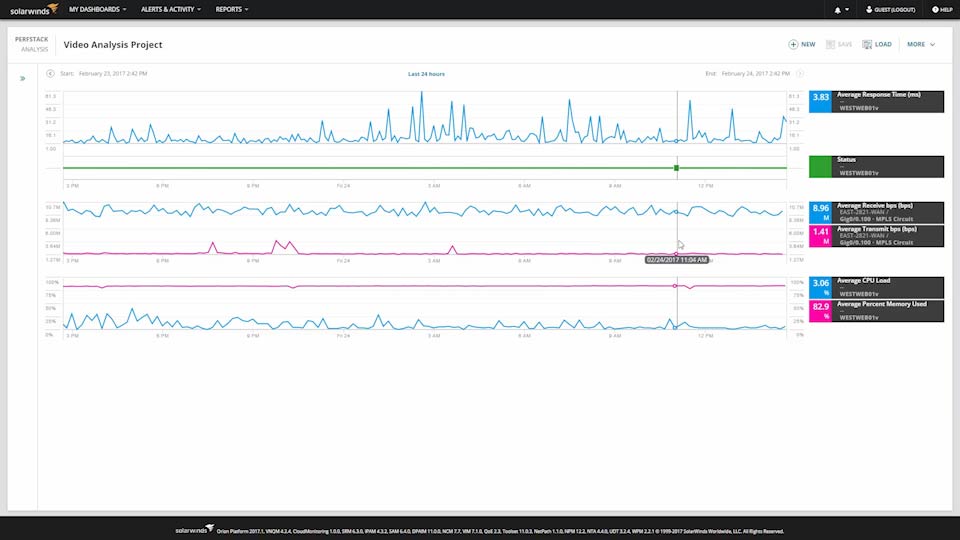
Accelerate identification of root cause by dragging-and-dropping network performance metrics on a common timeline for immediate visual correlation across all your network data.
Today’s networks are more complex, with more advanced hardware. Simply knowing if a device is up or down doesn’t tell you how your load balancer is managing application delivery or if your firewall is blocking the right traffic. Network Insight features for Cisco ASA, Cisco Nexus, F5 BIG-IP, and Palo Alto Networks help you troubleshoot your switches, firewalls, and load balancers like an expert.
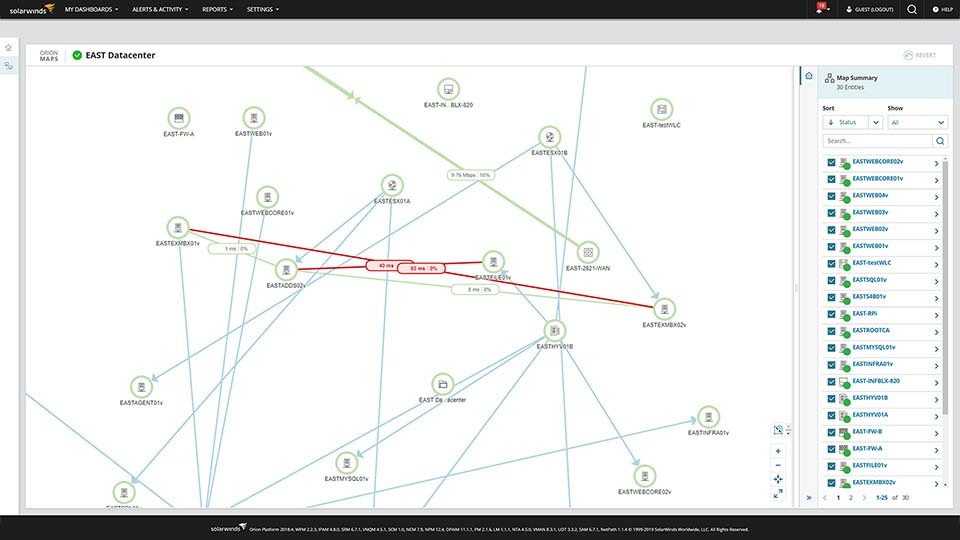
See relationships for routers, switches, interfaces, volumes, and groups, updated automatically without user intervention.
Want more customization? Build network maps from scratch or import auto-generated maps, customize layouts, and add them to any view or dashboard using the new Orion® Maps widget. Spend time maintaining your network, not your network maps.
Monitor logical components of the SDN environment, including APICs, tenants, application profiles, endpoint groups, and physical entities directly from your network monitoring tool.
Easily identify dead zones and improve wireless coverage. With our network monitoring tool, you can access out-of-the-box wireless reports, including wireless availability and rogue access points.
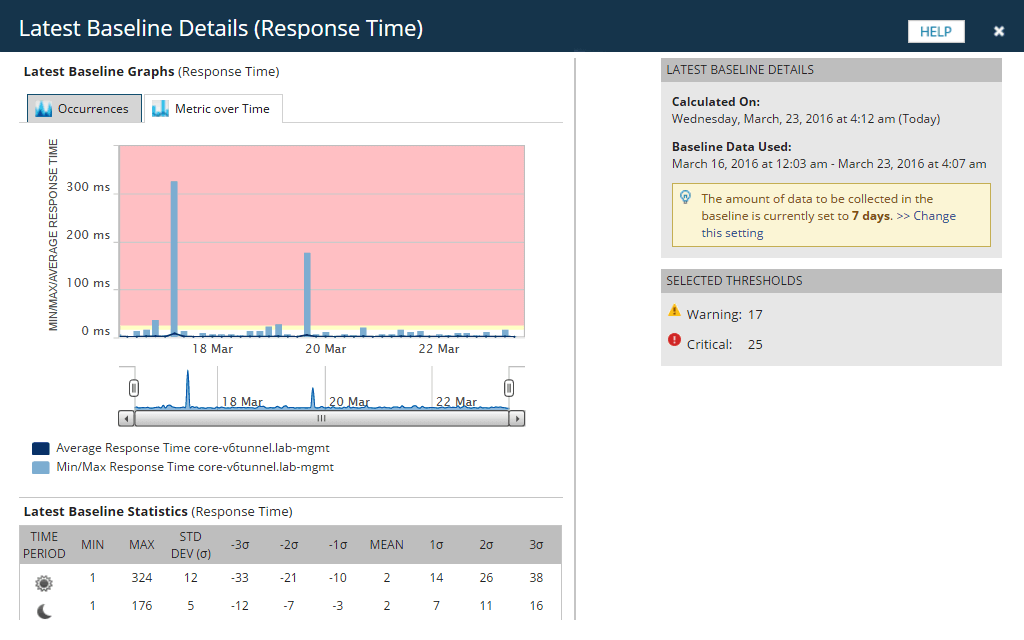
Configure alerts accurately by calculating dynamic baseline threshold data with our network performance monitoring software.
Drop disparate network monitoring tools and get comprehensive data in an integrated platform for greater visibility into monitoring network performance, all with flexible deployment and a lower TCO.
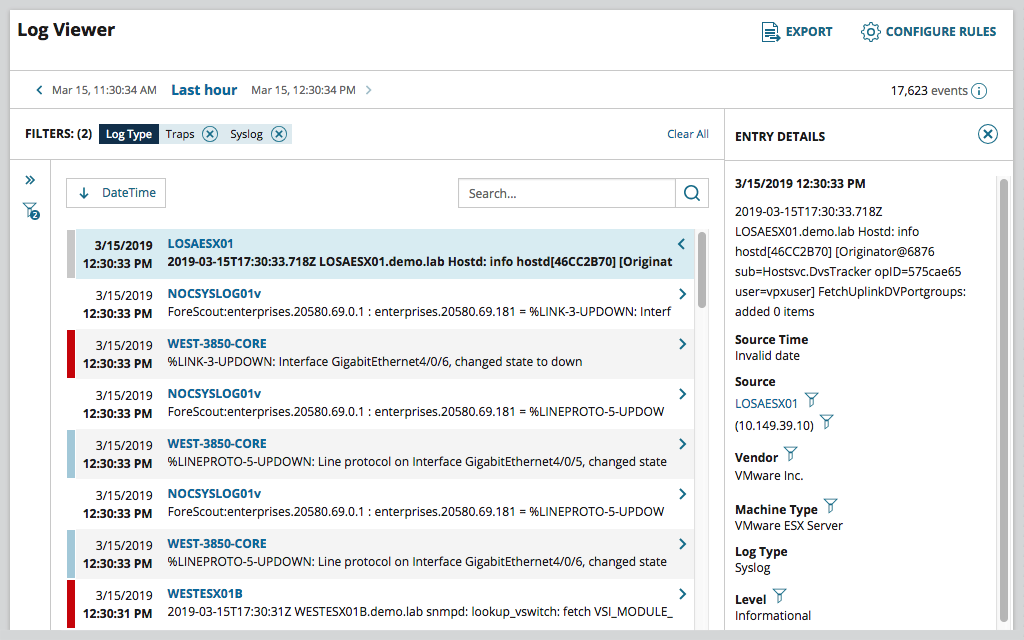
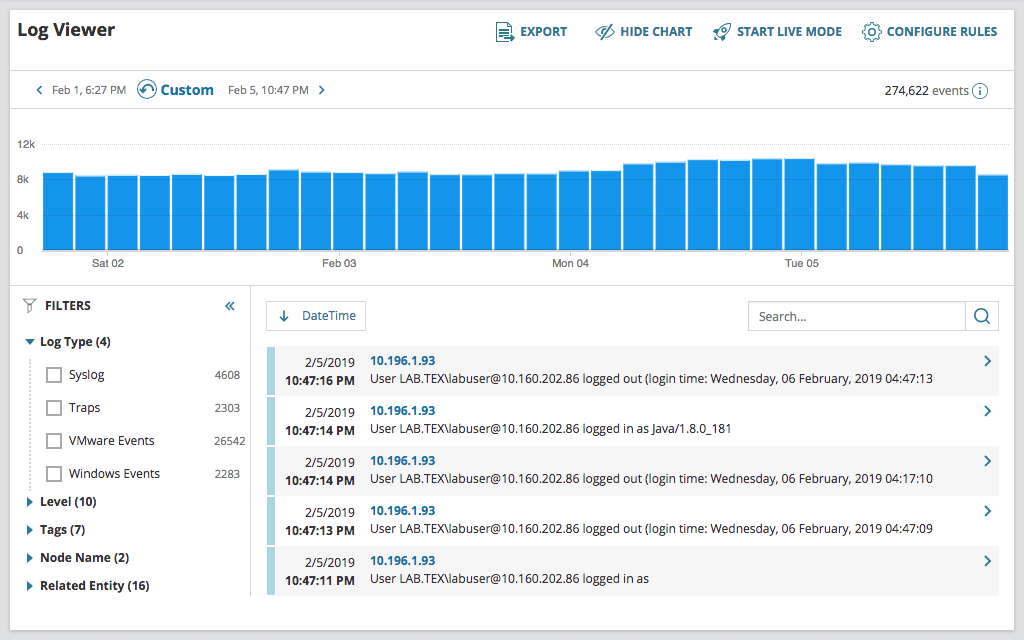
Use the Orion Log Viewer to collect, search, filter, and alert on syslogs and SNMP trap data from within the Orion console. NPM users can activate the functionality of Orion Log Viewer free with a trial of SolarWinds Log Analyzer. Orion Log Viewer helps you to correlate log data with performance and availability metrics on a common timeline so you can get to root cause faster. Even if your Log Analyzer trial expires, the Orion Log Viewer functionality stays activated in your NPM instance.
Gain the ability to increase frequency of polling, easily monitor remote locations, or scale to up to 12,000 additional elements per additional polling engine.
Protect your monitoring environment against O/S crashes, application failures, network connectivity problems, and database availability issues with SolarWinds High Availability.
SolarWinds Enterprise Operations Console collects performance data from an installed base of multiple SolarWinds servers, and summarizes this data into a composite, centralized view.
Your infrastructure is constantly generating log data to provide performance insight. Collect, consolidate, and analyze thousands of syslog, traps, Windows, and VMware events to perform root-cause analysis with log monitoring tools from Log Analyzer.
Perform searches using basic matching. Execute searches using multiple search criteria and apply filters to narrow results. Save, schedule, and export search results within the log monitoring software.
Traditional log collection and log management tools generate reports in plain text or HTML. SolarWinds® Log Analyzer displays logs in an interactive, real-time log stream.
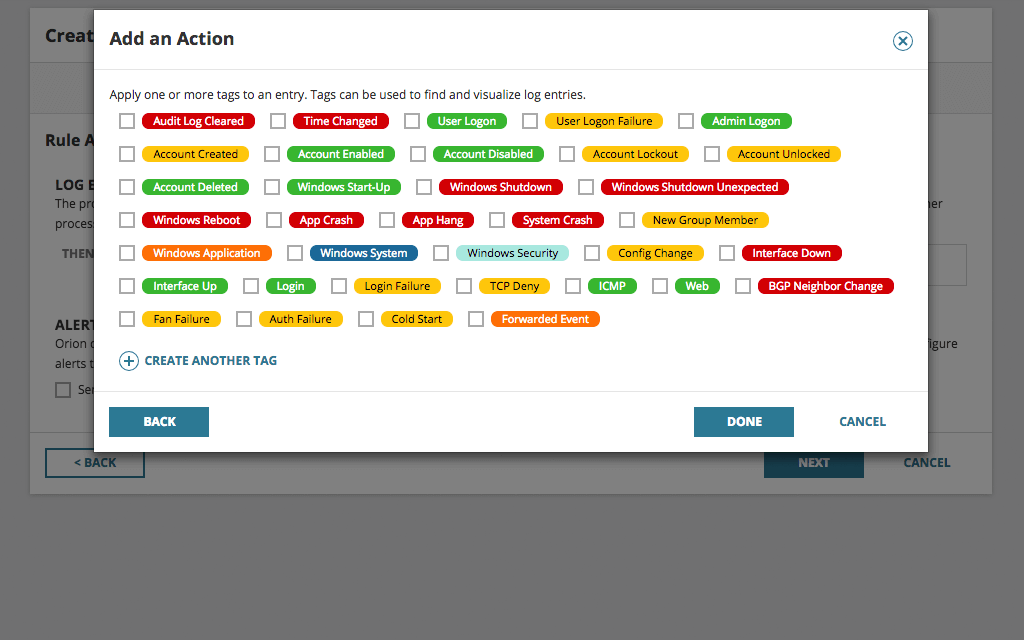
Easily apply (color-coded) tags to your log data to aid with filtering, searching, and identifying performance issues.
Log Analyzer can collect Windows flat log files and provide insight to help admins troubleshoot and resolve application issues faster.
SolarWinds Log Analyzer directly integrates your log and event data into the Orion Platform console so you can easily view log data alongside network and systems performance.
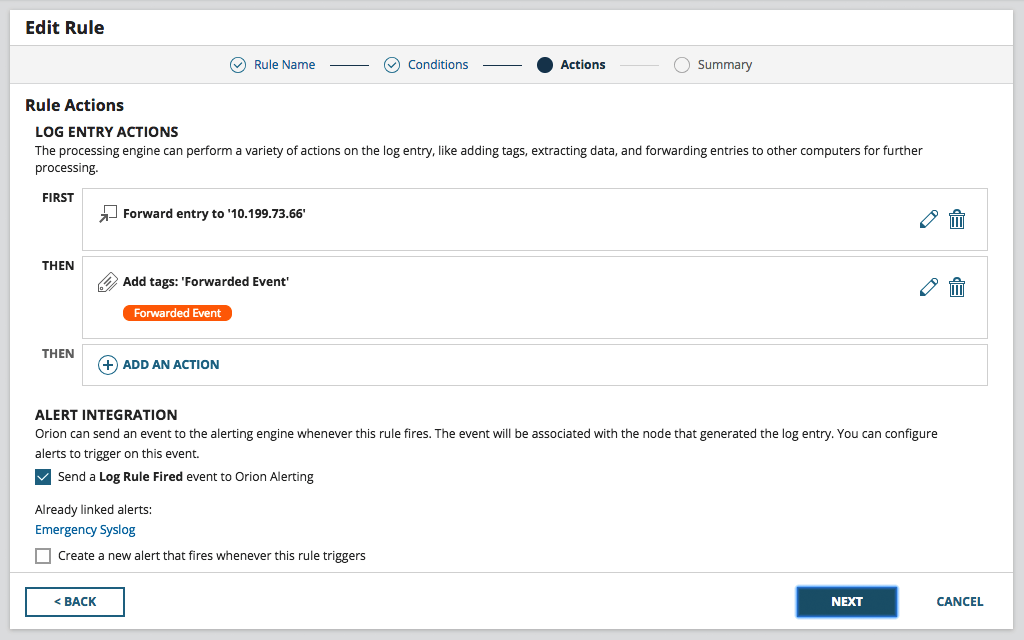
Be the first to know when issues arise. Log Analyzer integrates with the intelligent alert engine of Orion to provide customizable alerts along with delivery options including email notification, ServiceNow integration, and the triggering of an external script.
Having your log data in a central location is great for troubleshooting and correlation, but what if you need that useful data in other locations or tools? Log Analyzer allows you to forward logs to other applications, such as ticketing systems or SIEMs, and export log data to CSV files for even more flexibility.
See relationships for routers, switches, interfaces, volumes, and groups, updated automatically without user intervention.
Want more customization? Build network maps from scratch or import auto-generated maps, customize layouts, and add them to any view or dashboard using the new Orion® Maps widget. Spend time maintaining your network, not your network maps.
Traditional log collection and log management tools generate reports in plain text or HTML. SolarWinds® Log Analyzer displays logs in an interactive, real-time log stream.
Log Analyzer can collect Windows flat log files and provide insight to help admins troubleshoot and resolve application issues faster.
SolarWinds Log Analyzer directly integrates your log and event data into the Orion Platform console so you can easily view log data alongside network and systems performance.

Take Control of Your Monitoring With SolarWinds Network Performance Monitor: Customer Testimonial
Why I Recommend SolarWinds Network Performance Monitor (NPM)
“We just weren’t able to get those three different WAN providers to admit whose fault it was... Once we had this [the path], they had to stop pointing at the other guy … They stopped making excuses… we just couldn’t see the node problems until we had NetPath.”
"The NetPath feature solves our problem with regards to tracing the network bottleneck."
"Network Performance Monitor offers simplicity out of the box for most, but limitless deep dives into low-level customization for those that dare. It’s open, unobstructed and encouraged on THWACK™. Good stuff."
"Network Performance Monitor is simply the best monitoring solution I’ve ever used. Easy to setup, deploy and capture data."
The Success Center is your home for onboarding, training, new user information, the product knowledge base, and official product documentation. The Customer Portal is where you can submit a help desk ticket, find all of the information about the products you own, and see available hotfixes and upgrades as well as training opportunities for your products.