- Events
-
Partners
- Government
- Customer Portal
- Contact Us
- Contact Sales
-
English
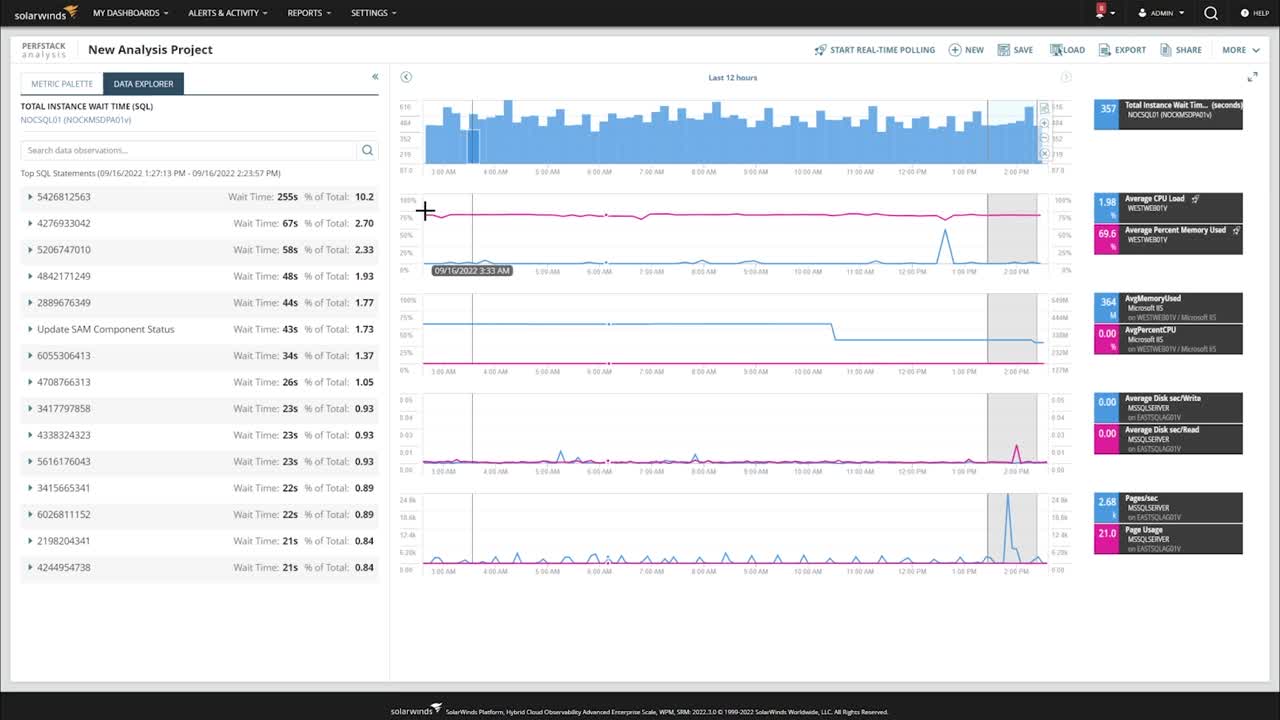
With SolarWinds Hybrid Cloud Observability, you can visualize and correlate data across the IT stack. PerfStack allows you to quickly sift through the massive amounts of collected data, filter out the noise, and focus on what’s truly relevant to the issue at hand. Drag and drop any entity’s performance metrics into a PerfStack project to quickly see time series and relationship data in one easy-to-view graph. With this kind of transparency, IT professionals can troubleshoot issues faster and pinpoint root cause in a flash.
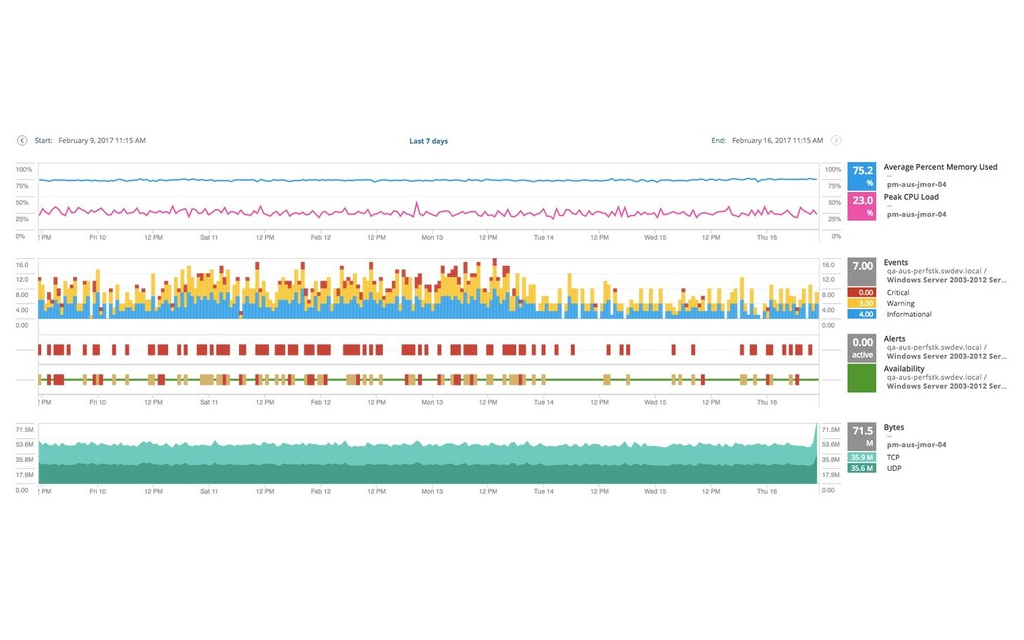
Do you need to go back in time to review when an issue first occurred? PerfStack pairs with historical tracking to provide contextually relevant data within a specified time frame. Do you also find yourself troubleshooting intermittent network slowdowns and want to track this behavior over time? With PerfStack, you can go back to a point in time to help you understand the cause of past system behavior.
Business application availability and performance are at the core of IT operations management. Often, the number one question to answer is “Is it the app or the network?” The PerfStack dashboard unites these IT environments in a single dashboard for quicker troubleshooting, enabling you to get the root cause of the issue faster.
With SolarWinds Hybrid Cloud Observability, you can visualize and correlate data across the IT stack. PerfStack allows you to quickly sift through the massive amounts of collected data, filter out the noise, and focus on what’s truly relevant to the issue at hand. Drag and drop any entity’s performance metrics into a PerfStack project to quickly see time series and relationship data in one easy-to-view graph. With this kind of transparency, IT professionals can troubleshoot issues faster and pinpoint root cause in a flash.
Do you need to go back in time to review when an issue first occurred? PerfStack pairs with historical tracking to provide contextually relevant data within a specified time frame. Do you also find yourself troubleshooting intermittent network slowdowns and want to track this behavior over time? With PerfStack, you can go back to a point in time to help you understand the cause of past system behavior.
Business application availability and performance are at the core of IT operations management. Often, the number one question to answer is “Is it the app or the network?” The PerfStack dashboard unites these IT environments in a single dashboard for quicker troubleshooting, enabling you to get the root cause of the issue faster.
Hybrid Cloud Observability
Infrastructure, network, and application performance observability
Physical and virtual hosts, SD-WAN, and device monitoring
Automated discovery and dependency mapping