- Events
-
Partners
- Government
- Customer Portal
- Contact Us
- Contact Sales
-
English
Intelligent Troubleshooting
Baseline Thresholds - The statistical, threshold-based alerting feature dynamically calculates baseline performance while monitoring. It helps you avoid extraneous alerts, simplify problem identification, and accelerate troubleshooting.
Smart features significantly reduce alert noise so you can focus on actual problems and get to the root cause of performance problems fast.
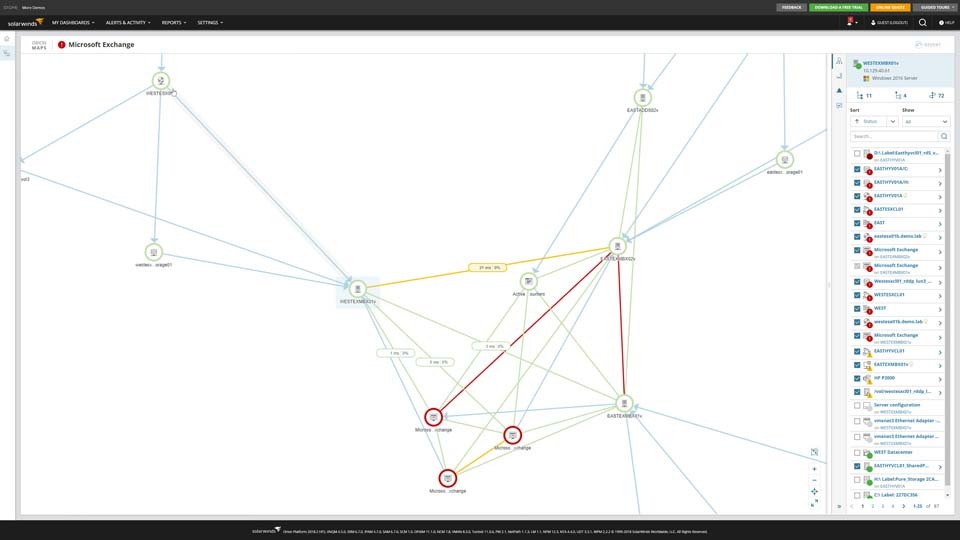
Application discovery tools provide visibility into server activity, allowing you to view what inbound connections are linked to your applications and servers. You can also more easily identify the incoming port, service, and server to determine internal resource consumption.
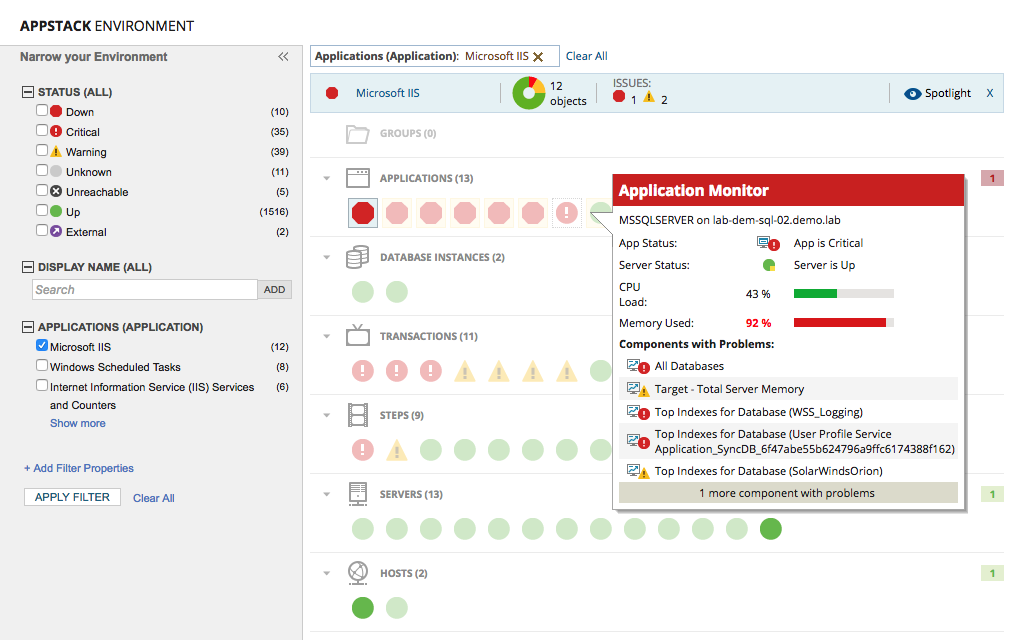
Auto-populated application stack – AppStack™ lets you see the application and all the underlying layers it’s dependent on, down to the storage volumes and APIs.
Drag-and-drop metric correlation dashboard – PerfStack™ allows you to drag and drop metrics, events, configuration changes, etc., and visually correlate them in a single customized view, making it easy to identify the root cause of network, infrastructure, or application performance issues.
Consult graphs or tables to see usage trends of devices on your network, infrastructure, and applications and find out when devices will reach full capacity. Identify when server resources reach warning and critical thresholds.
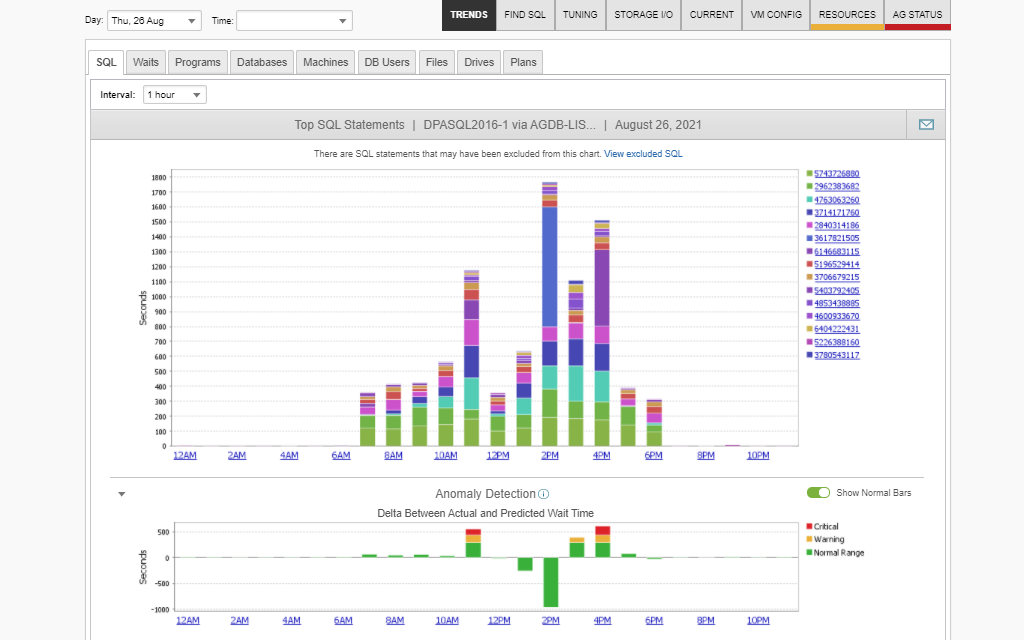
Database Performance Analyzer (DPA) uses an anomaly detection algorithm to determine if the wait times for a database instance are significantly higher than usual. In some cases, high wait times are typical and expected.
SolarWinds® Hybrid Cloud Observability (HCO) virtualization performance management has built-in, actionable intelligence providing recommendations and a click-to-implement function to optimize your VMware vSphere and Microsoft Hyper-V environments.
Intelligent Troubleshooting
Baseline Thresholds - The statistical, threshold-based alerting feature dynamically calculates baseline performance while monitoring. It helps you avoid extraneous alerts, simplify problem identification, and accelerate troubleshooting.
Smart features significantly reduce alert noise so you can focus on actual problems and get to the root cause of performance problems fast.
Application discovery tools provide visibility into server activity, allowing you to view what inbound connections are linked to your applications and servers. You can also more easily identify the incoming port, service, and server to determine internal resource consumption.
Auto-populated application stack – AppStack™ lets you see the application and all the underlying layers it’s dependent on, down to the storage volumes and APIs.
Drag-and-drop metric correlation dashboard – PerfStack™ allows you to drag and drop metrics, events, configuration changes, etc., and visually correlate them in a single customized view, making it easy to identify the root cause of network, infrastructure, or application performance issues.
Consult graphs or tables to see usage trends of devices on your network, infrastructure, and applications and find out when devices will reach full capacity. Identify when server resources reach warning and critical thresholds.
Database Performance Analyzer (DPA) uses an anomaly detection algorithm to determine if the wait times for a database instance are significantly higher than usual. In some cases, high wait times are typical and expected.
SolarWinds® Hybrid Cloud Observability (HCO) virtualization performance management has built-in, actionable intelligence providing recommendations and a click-to-implement function to optimize your VMware vSphere and Microsoft Hyper-V environments.
Hybrid Cloud Observability
Infrastructure, network, and application performance observability
Physical and virtual hosts, SD-WAN, and device monitoring
Automated discovery and dependency mapping