- Events
-
Partners
- Government
- Customer Portal
- Contact Us
- Contact Sales
-
English
A ping sweep is a trusted method of diagnosing network performance issues. Most operating systems include a basic ping sweep function, and SolarWinds® Engineer’s Toolset™ (ETS) expands upon your ping sweep capabilities with several unique Ping tools.
First, Engineer’s Toolset allows you to identify the specific IP addresses causing performance issues. Then, with one click, you can select devices to ping, initiate a proxy ping from a remote router, and view various metrics to identify slow packet response times.
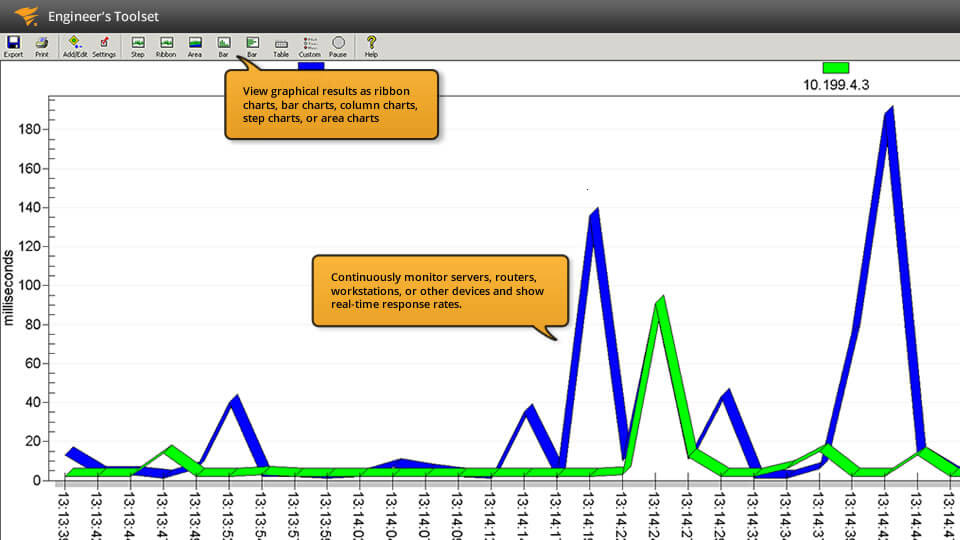
To expand the functionality of your Ping tools, Engineer’s Toolset offers Enhanced Ping. The purpose of Enhanced Ping is to engage with ping sweeps in an automated way. Instead of selecting suspicious IP addresses to ping when an issue arises, Enhanced Ping allows you to continuously monitor packet response times across your network. With Enhanced Ping, you can view response time trends with user-friendly graphics, and preemptively diagnose issues before they affect other areas of your network.
To understand the root cause of slow end-user performance, effective network troubleshooting requires insight into a wide variety of network components. The TraceRoute tool helps you go beyond guesswork to quickly determine problematic IP addresses and devices.
With a web-based interface, TraceRoute is built to provide a clear overview of network paths. It uses ICMP to track device metrics, with a focus on packet routes. TraceRoute is designed to help you easily identify segments performing poorly, so you can troubleshoot right away.
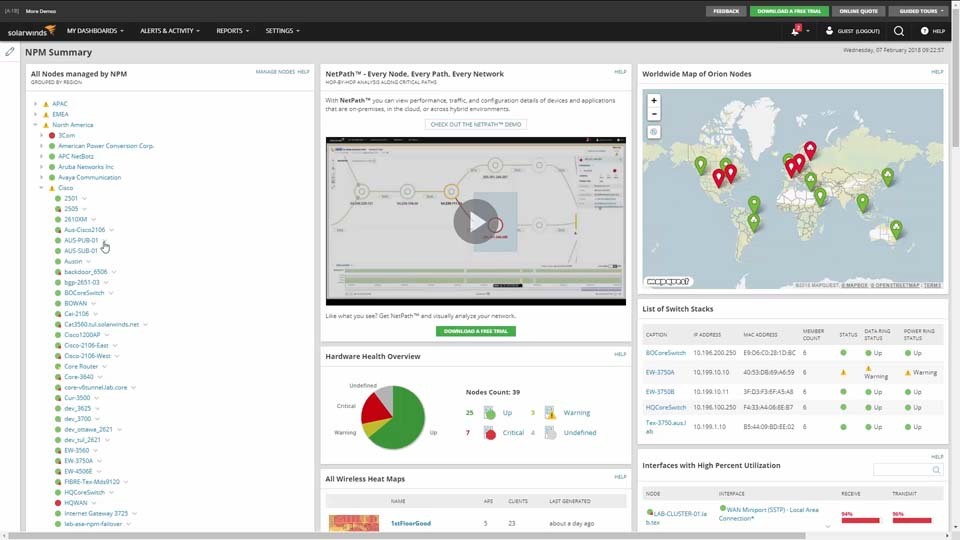
Network management requires insight into a large number of nodes, servers, and IP addresses. To make sense of your network layout, you can use the DNS Analyzer tool in your Engineer’s Toolset dashboard. DNS Analyzer is built to offer a visual representation of every network component in your DNS records, including IP addresses, servers, pointers, and more. With an intuitive view of your network hierarchy, you can quickly understand what nodes are affected by performance issues.
With SolarWinds Engineer’s Toolset, you can access over 60 unique network management tools from a unified dashboard. With an integrated approach, you can easily view real-time metrics for latency, traffic, node status, and more—all from a single pane of glass.
In addition to network monitoring, network diagnostic tools can assist in troubleshooting. When slow network performance occurs, network diagnostic tools—like network tracing, DNS analytics, ping sweeps, and more—allow you to discover root causes and quickly start tackling the issue.
Network diagnostic tools are built to help you to identify the root causes of network performance issues. The manual troubleshooting process can cost your business precious time and resources if your diagnostic efforts rely on guesswork and manual network diagrams. Diagnosing slow network performance can be easier with assistance from automated tools.
Before you can diagnose network performance issues, you must first recognize there is an issue. To effectively monitor your network, you need a comprehensive view of the major network performance indicators—like latency, device and node statuses, traffic, and bandwidth—which is why network diagnostic tools are often paired with network performance monitoring tools.
Once you’ve identified an area of slow performance, it’s time for network diagnostics. Network diagnostic tools provide various services designed to pinpoint the root cause of network downtime. Some of the functions offered by diagnostic tools include request tracing, log and database tracing, and Ping tools, which compare packet response times to different nodes.
Network diagnostic software offers a way to pinpoint network issues both quickly and accurately, which can help speed up troubleshooting and ensure a good end-user experience.
With performance monitoring alone, you might be able to recognize an issue exists, but figuring out the nature of the problem may take some time if you’re limited to running manual tests. You may even miss the real root cause of an issue due to human error. Without a clear diagnosis to troubleshoot effectively, end users may continue to experience slow performance or downtime, leading to lost productivity.
In contrast, network diagnostic software allows you to run various fast, straightforward tests to discover the nature of existing issues or even proactively detect potential problems that haven’t yet had an impact on performance. Automated diagnostics tools are critical for all sizes of networks and can help save time and money.
While diagnostics is an integral component of troubleshooting, it’s important to understand the distinction between the two concepts. In short, troubleshooting involves resolving network issues, while diagnostic tools help you to identify the root cause of an issue before troubleshooting begins.
For example, if your network monitoring tools indicate a slower-than-average response time for a specific node, diagnostics can help you to understand which part of your network is the source of the problem. After you’ve diagnosed the root cause, troubleshooting is the process of fixing the problem for improved network performance.
SolarWinds Engineer’s Toolset (ETS) offers over 60 network management tools, including several network diagnostic tools. To identify the root cause of network performance issues, Engineer’s Toolset offers unique services for network diagnostics, including TraceRoute, DNS Analyzer, Enhanced Ping, and various other Ping sweep tools.
TraceRoute uses network paths to help you identify IP addresses and devices causing slow network performance. It makes it easier to discover the problematic device from among a large number of interconnected nodes. With TraceRoute, you can use ICMP to view packet metrics at each point along a packet’s route through your network—all from your Engineer’s Toolset control center.
DNS Analyzer is another staple of diagnostics in Engineer’s Toolset. Instead of keeping manual records of your network structure, you can use DNS Analyzer to visualize your complete network layout. View user-friendly graphics to indicate the types of devices at each node and understand the hierarchy of nodes in your network.
In addition, Engineer’s Toolset offers various Ping tools to integrate, expand on, and automate the basic ping services included in your operating system. “Simple Ping” diagnostics allow you to gather native ping metrics, log response times, and export ping data using graphs and text reports. Enhanced Ping expands your ping services even further, with a running ping service designed to continuously ping devices and collect response time metrics automatically. Enhanced Ping is built to let you view graphs of response time statistics, receive alerts for unusual ping data, and understand packet loss trends before they become a problem.
In addition to network diagnostic tools, Engineer’s Toolset includes over 60 network management tools accessible from a unified control center. A diverse array of network monitoring tools allows you to ensure your network is running smoothly and securely, and to identify performance issues fast.
Other tools from Engineer’s Toolset can assist with:
No matter what aspect of your network you need to manage, one of the 60-plus tools in Engineer’s Toolset probably has you covered. From a unified control center, Engineer’s Toolset provides dashboards to quickly access each of your network management tools. From network diagnostic tools to monitoring to cyberthreat prevention, Engineer’s Toolset can make network management more effective and more efficient than ever.
Engineer's Toolset
Identify and measure packet loss with Ping tools
Trace your network path for insight into response-time issues
Get a bird’s-eye view of network resources, including graphical analytics