- Events
-
Partners
- Government
- Customer Portal
- Contact Us
- Contact Sales
-
English
Windows services constantly run in the background of your server operations and can be critical to end users. To prevent downtime, SolarWinds® ipMonitor® offers around-the-clock Windows application monitoring to help you identify performance issues in essential services.
Windows application and service monitors in SolarWinds ipMonitor include:
For businesses operating on a Windows OS, Windows applications and services provide the building blocks of your end-user experience. Services run 24 hours a day to ensure effective web-layer performance and prevent downtime. Although your users may never actually interact with these services, the health of these services is crucial to an effective IT environment. Windows application monitoring is a critically important tool in helping you offering the best possible user experience.
Since end-user services are often dependent on lower-layer applications and services, Windows monitors are critically important in preventing downtime. By preventing downtime, Windows service monitoring can provide many key benefits, including:
Application and service monitoring can be broken down into two general types of monitors: application monitors (for services on the application layer), and service monitors (referring to on-premises and lower-layer services). The goal of service monitors is to identify performance issues with a service and alert IT admins on these performance issues before they can affect the end-user experience.
The monitoring process begins with discovering each service you wish to monitor. Then, you can configure and customize a unified list of applications and services you’re monitoring from your central dashboard.
Since Windows application and service monitoring tools can offer tracking for a wide range of services, it’s often not necessary to implement separate monitoring strategies for on-premises versus application-layer services.
SolarWinds ipMonitor includes an agentless Discovery Wizard, which allows you to quickly identify the services you wish to monitor. To add a new device, simply add or edit the service’s hostname or IP address. Then, from the Devices tab on your ipMonitor dashboard, you can select discoverable devices to add to your list of active monitors.
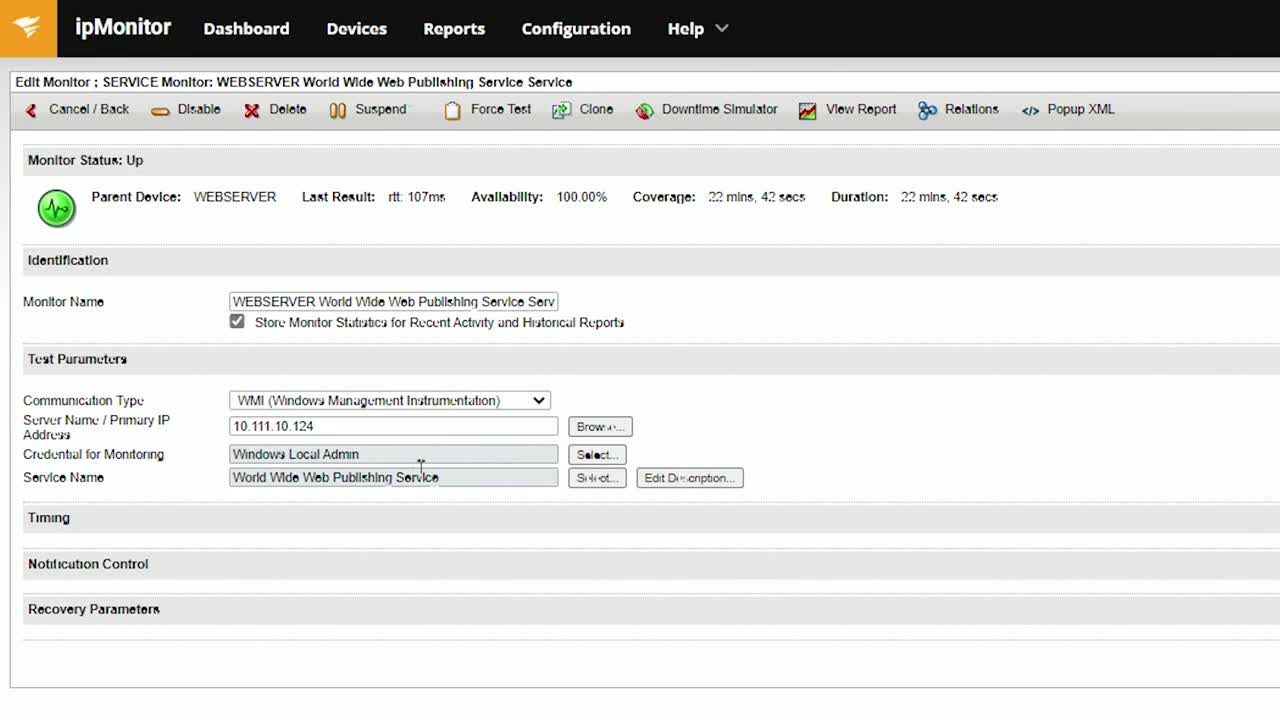
Once you attach monitors to your dashboard, you can view performance summaries for services using a customizable widget. For rapid performance indicators, ipMonitor provides an even simpler color-coded assessment of your monitor state on your Administrator dashboard.
The final step in executing a monitoring protocol is configuring alerts. SolarWinds ipMonitor allows you to view alerts in the format of your choice, such as a text message, email, or a more detailed Windows Event Log file.
SolarWinds ipMonitor is built with many Windows monitors and can provide streamlined setup and user experience. For IT admins, accessing systems monitors in one convenient location is the key to more efficient operation.
Windows application and service monitors available in SolarWinds ipMonitor include:
These are just a few of the many monitors you can access using SolarWinds ipMonitor, complete with real-time alerting. When you combine this range of monitors with the streamlined usability in ipMonitor, you can address performance issues more efficiently than ever.
To organize your monitoring process, you can view monitoring widgets in customizable categories on the ipMonitor dashboard. Several categories of monitors are available, offering a bird’s-eye view of your service-end performance.
ipMonitor offers monitors in the following categories:
From VMware monitors to hardware monitors to application monitors, SolarWinds ipMonitor provides a complete list of monitor categories for effective systems monitoring. With detailed insight into your performance, you can understand exactly where a bottleneck is developing in real time and minimize downtime for successful IT services and satisfied users.
For businesses operating on a Windows OS, Windows applications and services provide the building blocks of your end-user experience. Services run 24 hours a day to ensure effective web-layer performance and prevent downtime. Although your users may never actually interact with these services, the health of these services is crucial to an effective IT environment. Windows application monitoring is a critically important tool in helping you offering the best possible user experience.
Since end-user services are often dependent on lower-layer applications and services, Windows monitors are critically important in preventing downtime. By preventing downtime, Windows service monitoring can provide many key benefits, including:
Application and service monitoring can be broken down into two general types of monitors: application monitors (for services on the application layer), and service monitors (referring to on-premises and lower-layer services). The goal of service monitors is to identify performance issues with a service and alert IT admins on these performance issues before they can affect the end-user experience.
The monitoring process begins with discovering each service you wish to monitor. Then, you can configure and customize a unified list of applications and services you’re monitoring from your central dashboard.
Since Windows application and service monitoring tools can offer tracking for a wide range of services, it’s often not necessary to implement separate monitoring strategies for on-premises versus application-layer services.
SolarWinds ipMonitor includes an agentless Discovery Wizard, which allows you to quickly identify the services you wish to monitor. To add a new device, simply add or edit the service’s hostname or IP address. Then, from the Devices tab on your ipMonitor dashboard, you can select discoverable devices to add to your list of active monitors.
Once you attach monitors to your dashboard, you can view performance summaries for services using a customizable widget. For rapid performance indicators, ipMonitor provides an even simpler color-coded assessment of your monitor state on your Administrator dashboard.
The final step in executing a monitoring protocol is configuring alerts. SolarWinds ipMonitor allows you to view alerts in the format of your choice, such as a text message, email, or a more detailed Windows Event Log file.
SolarWinds ipMonitor is built with many Windows monitors and can provide streamlined setup and user experience. For IT admins, accessing systems monitors in one convenient location is the key to more efficient operation.
Windows application and service monitors available in SolarWinds ipMonitor include:
These are just a few of the many monitors you can access using SolarWinds ipMonitor, complete with real-time alerting. When you combine this range of monitors with the streamlined usability in ipMonitor, you can address performance issues more efficiently than ever.
To organize your monitoring process, you can view monitoring widgets in customizable categories on the ipMonitor dashboard. Several categories of monitors are available, offering a bird’s-eye view of your service-end performance.
ipMonitor offers monitors in the following categories:
From VMware monitors to hardware monitors to application monitors, SolarWinds ipMonitor provides a complete list of monitor categories for effective systems monitoring. With detailed insight into your performance, you can understand exactly where a bottleneck is developing in real time and minimize downtime for successful IT services and satisfied users.
ipMonitor
Use intuitive configuration with agentless discovery for a wide range of different monitor types.
Get real-time alerts delivered directly to your inbox to quickly address downtime.
View monitor widgets from a central dashboard to dive into status details for each of your Windows services.